Essay · YIMBY
YIMBY data projects, between naps

Parenting an infant gives you 20 minutes here, an hour there. There’s never enough to context-switch into “real work”.
It’s enough time for me to build small civic data projects with Claude Code.
All 3 of the projects below answer local political arguments I’ve heard at public meetings in San Mateo.
Each project lives at a public URL, each took a handful of hours across my naps, and each is meant to be cited/shared forward!
1. Permit Timeline Tracker
![]()
A ranking of 22 Peninsula cities by construction permitting speed, California’s regional housing needs allocation (RHNA) progress, and ADU compliance, pulled from the CA Housing & Community Development office’s annual progress reports. Friction scores are per jurisdiction & sortable.
This is useful if you’re testifying at a public hearing and want to compare your council’s record to its neighbors’.
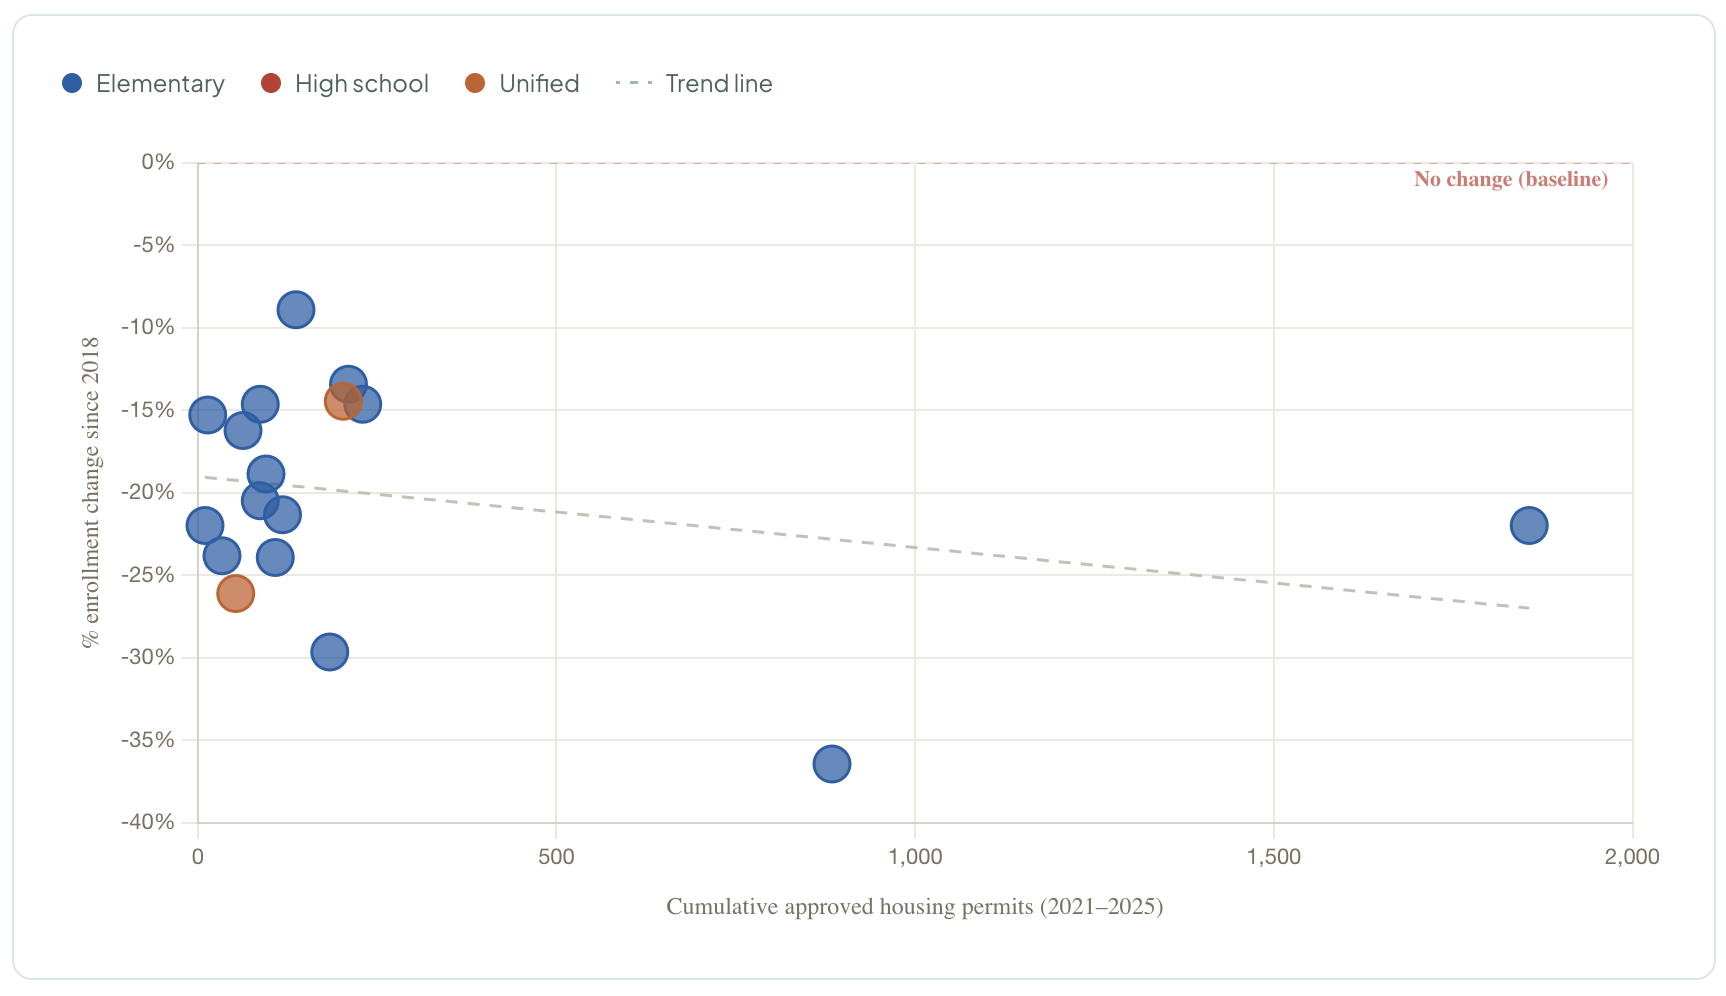
2. Enrollment Decline vs. Housing Production
→ peninsula-enrollment-decline
A scatter plot, basically. Every San Mateo County school district, plotted against housing permits issued 2021–2025 and enrollment change since 2018. The schools argument predicts a positive slope. The actual slope is flat to slightly negative — and every district sits below the zero line. Redwood City and South San Francisco, which permitted hundreds of units, show declines indistinguishable from Hillsborough and Portola Valley, which built almost nothing. Cost-driven family displacement has been emptying Peninsula classrooms since 2015. The predicted signal is simply absent.
3. SB 79 Capacity Analysis
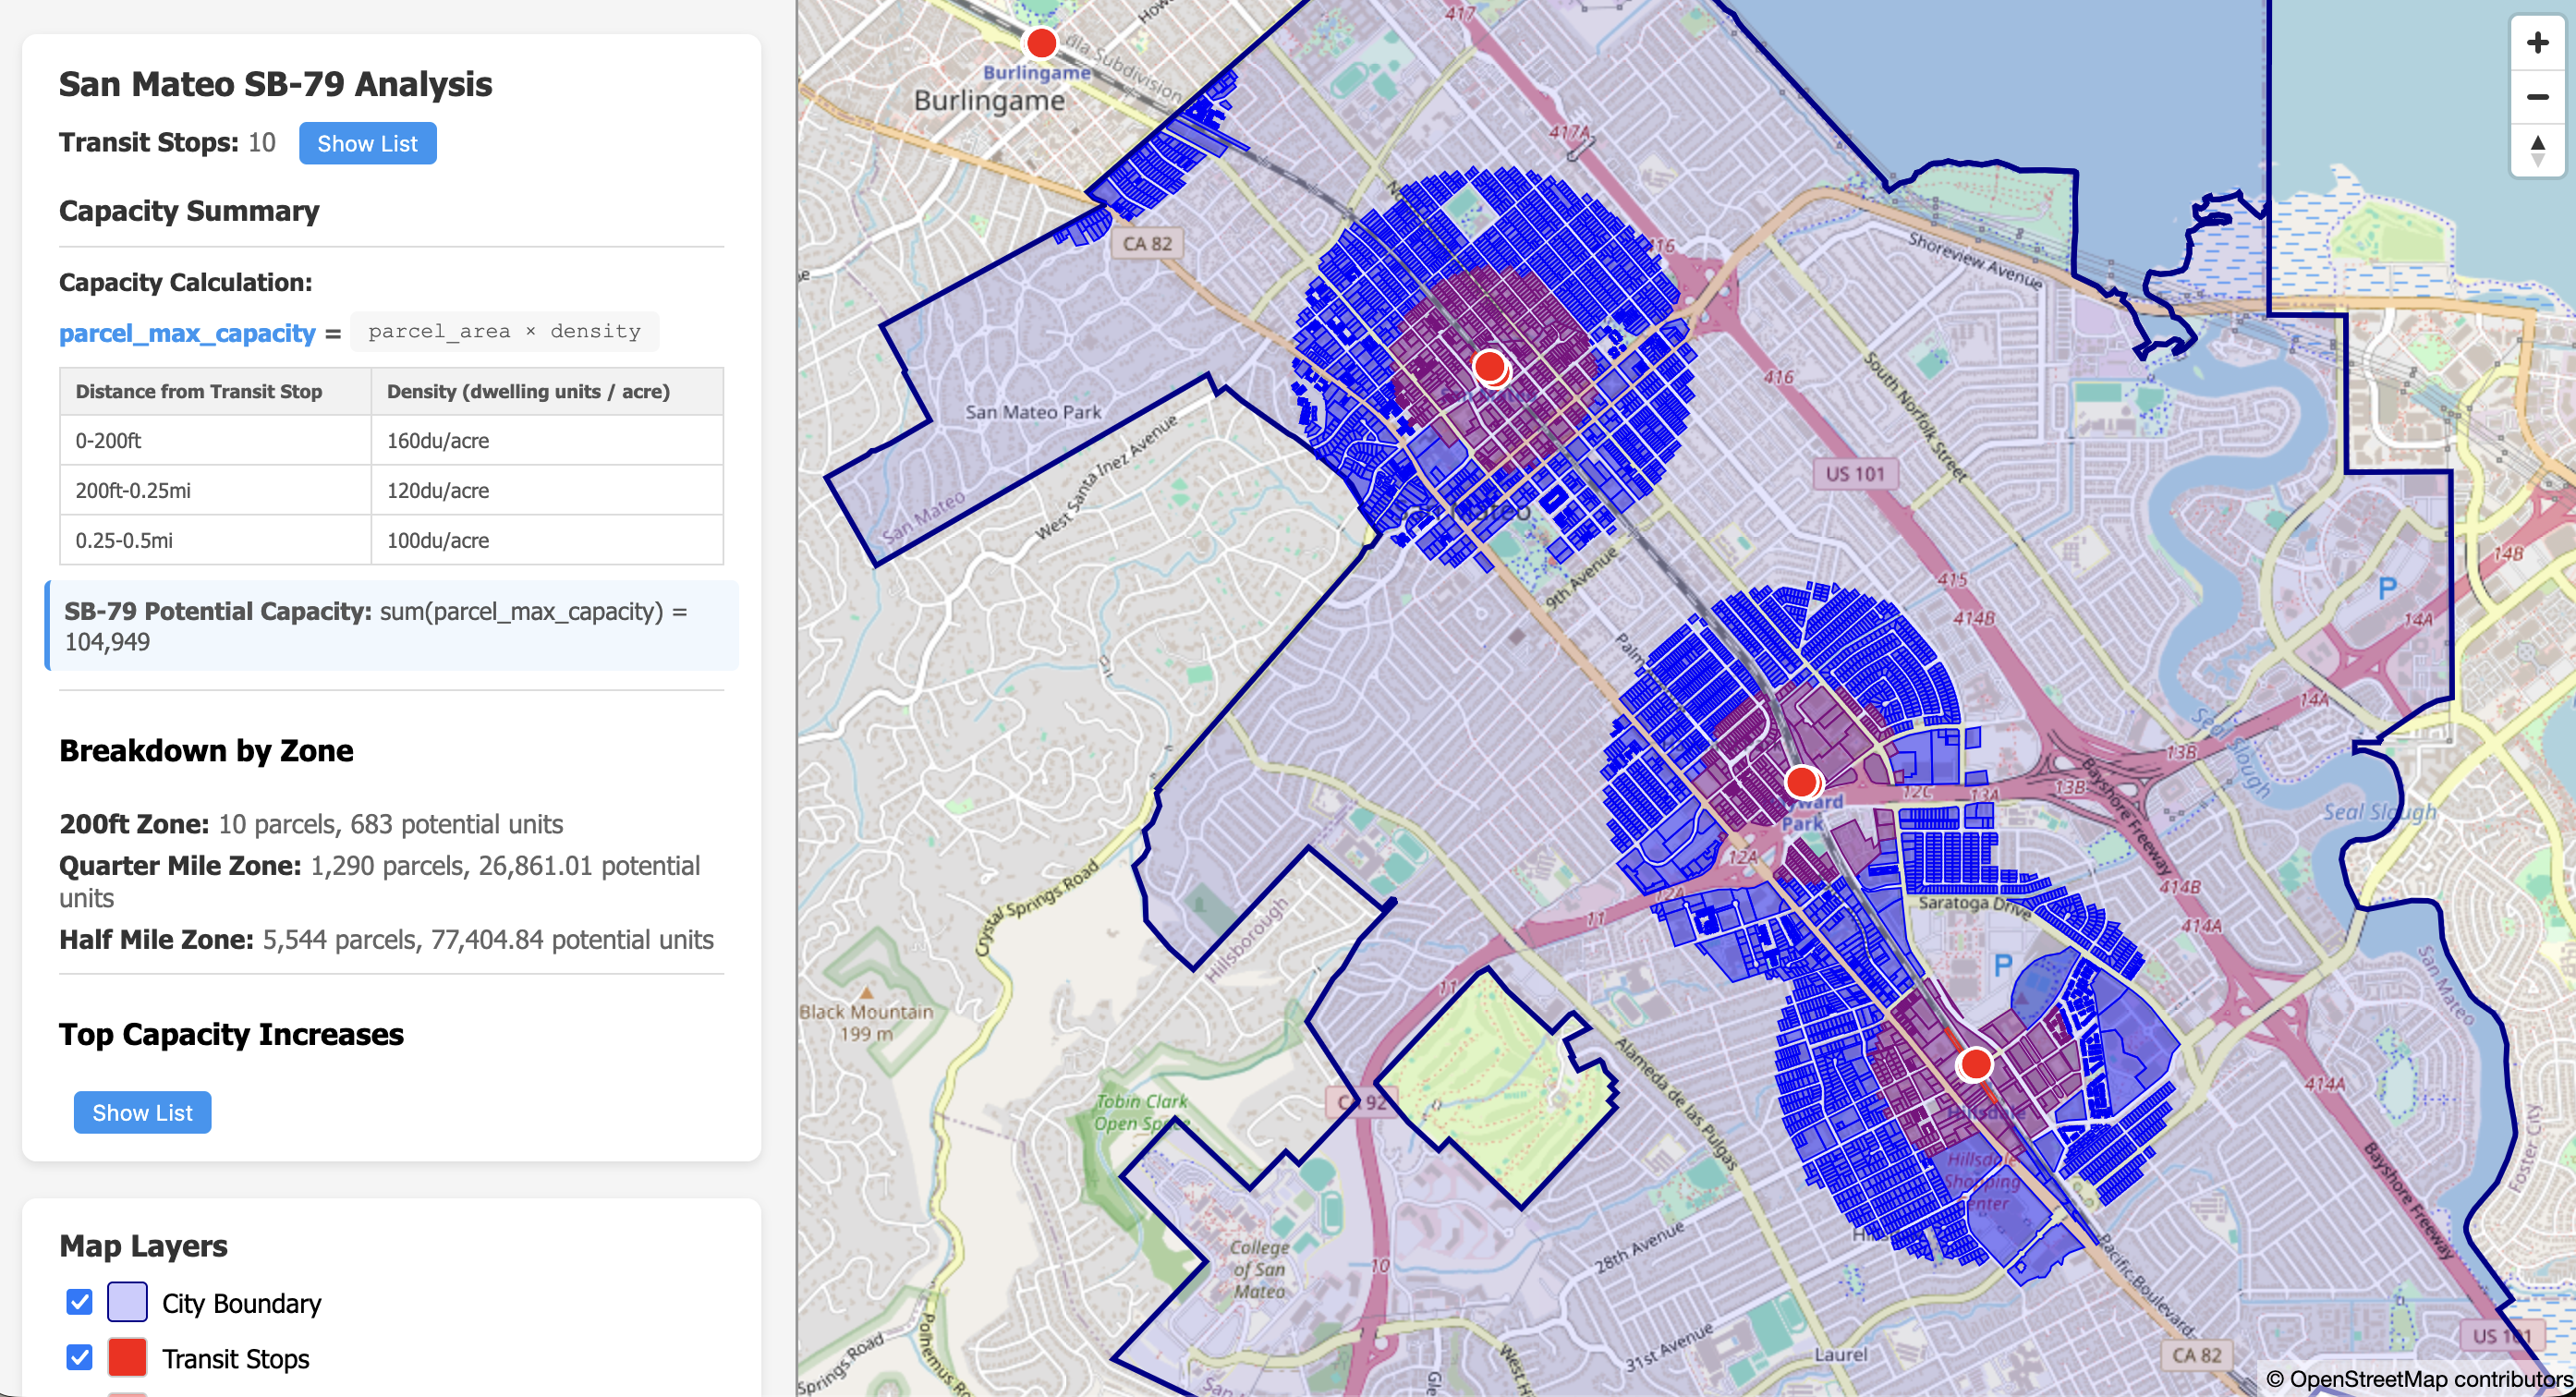
A live, parcel-level map of what California’s transit-oriented zoning bill would permit within walking distance of every qualifying stop on the Peninsula: 160 du/acre within 200 feet, 120 within a quarter mile, 100 within a half mile, minus what’s already there. The aggregate net-new capacity is meaningfully larger than the discourse around the bill suggests.
Takeaways
The marginal cost of producing a small, well-sourced, embeddable civic data project has collapsed to basically nothing.
None of these projects required a journalist, grant funding, or a year of GIS expertise (I do not know any GIS).
It required publicly available data (discovered by Claude), a few evenings, and a coding agent.
If there’s a local fight happening near you (housing, transit, schools, parking) — anything where someone is making an empirical claim — there is now a reasonable chance you can answer them with a webpage hosted on GitHub Pages in a couple hours.
Pick the NIMBY claim that bothers you most, open Claude Code, and see how far you get before the baby wakes up (or you doze off!).
Enjoyed this post? Get new posts via email