Essay · MOBILITY
Too many roads

The bus down El Camino Real through Burlingame was bumpy enough to unsettle the man across from me, a tourist from Ireland. I apologized for the state of the road, that we build roads but don’t necessarily maintain them. He gave me a suggestion that I took home with me: “Perhaps the problem in the US is simple: there are too many roads to maintain them all in America.”
I came home and looked it up. By roadway mileage per capita, America and Ireland are tied. The US has 4.2 million miles of public road, about 20 meters per resident. Ireland has 99,830 kilometers, about 19 meters per resident.1
A national average mixes Manhattan with a town in the wheat fields of North Dakota, though. The comparison that matters is between American cities, where every mile counted is urban and the differences come down to how each place was built.
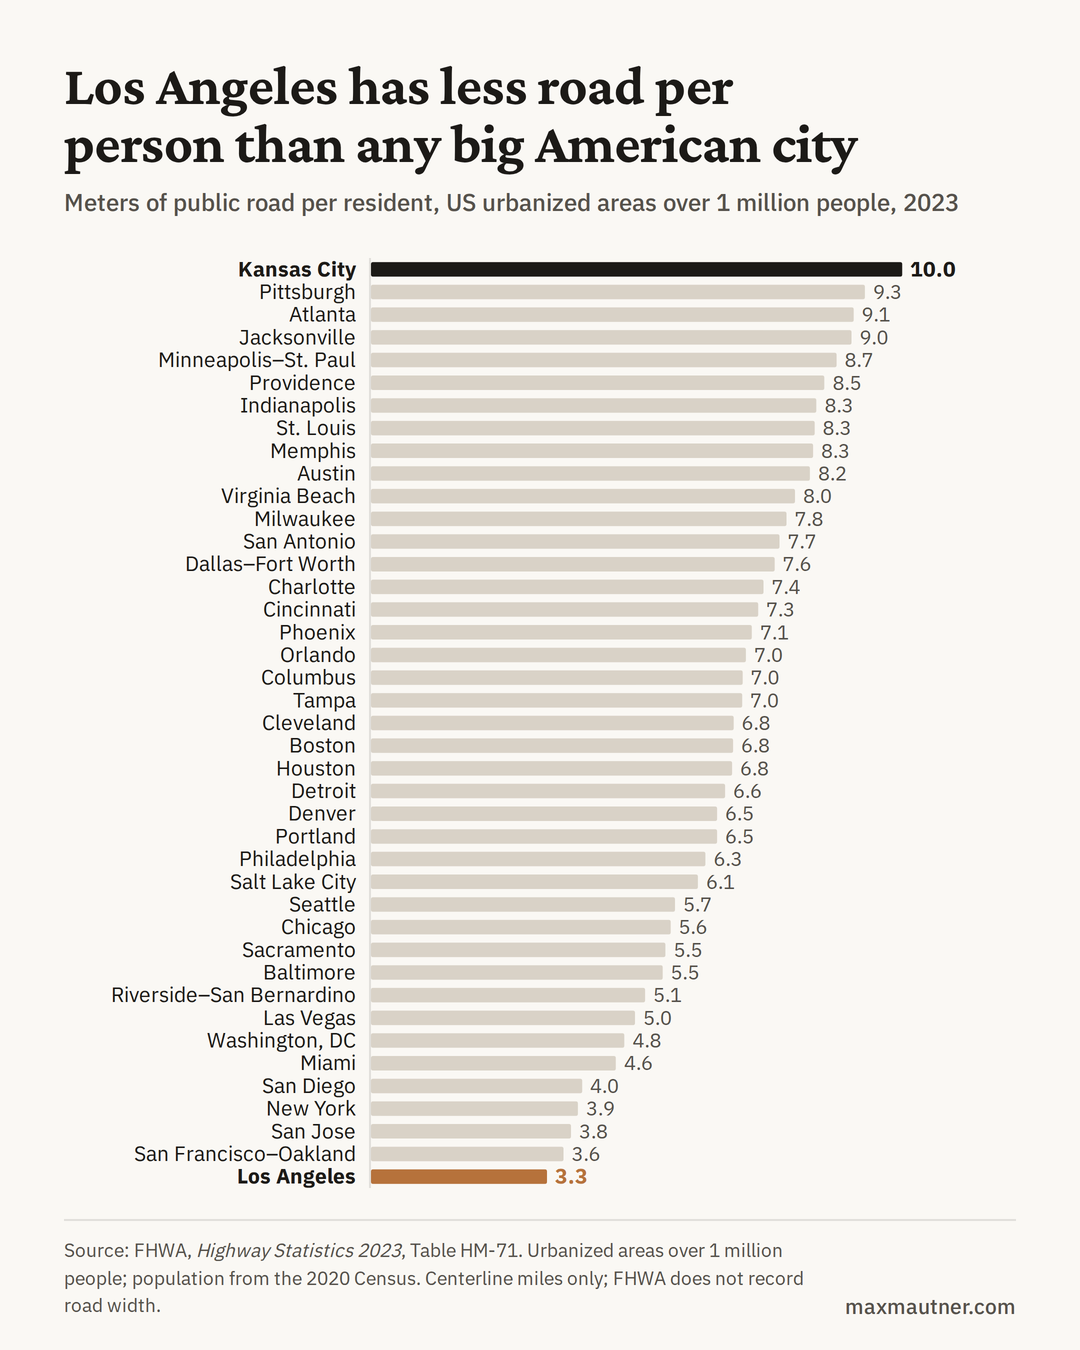
Los Angeles, known for its car culture, has less road per resident than New York. Counting its suburbs doesn’t change that: the 11 urbanized areas of greater Southern California from Santa Clarita to Temecula come to 3.8 meters per resident together. Kansas City has 9.1.2
Every mile of road in Los Angeles has 500 residents to pay for its upkeep, while every mile in Kansas City has 177. Density diminishes road upkeep cost by spreading it over a bigger tax base.
Despite a healthy tax base California’s roads are still in rough condition. The Bay Area and Los Angeles rank among the worst in the country for pavement condition, as the Irishman noticed.3 That comes from the other end of the ratio:
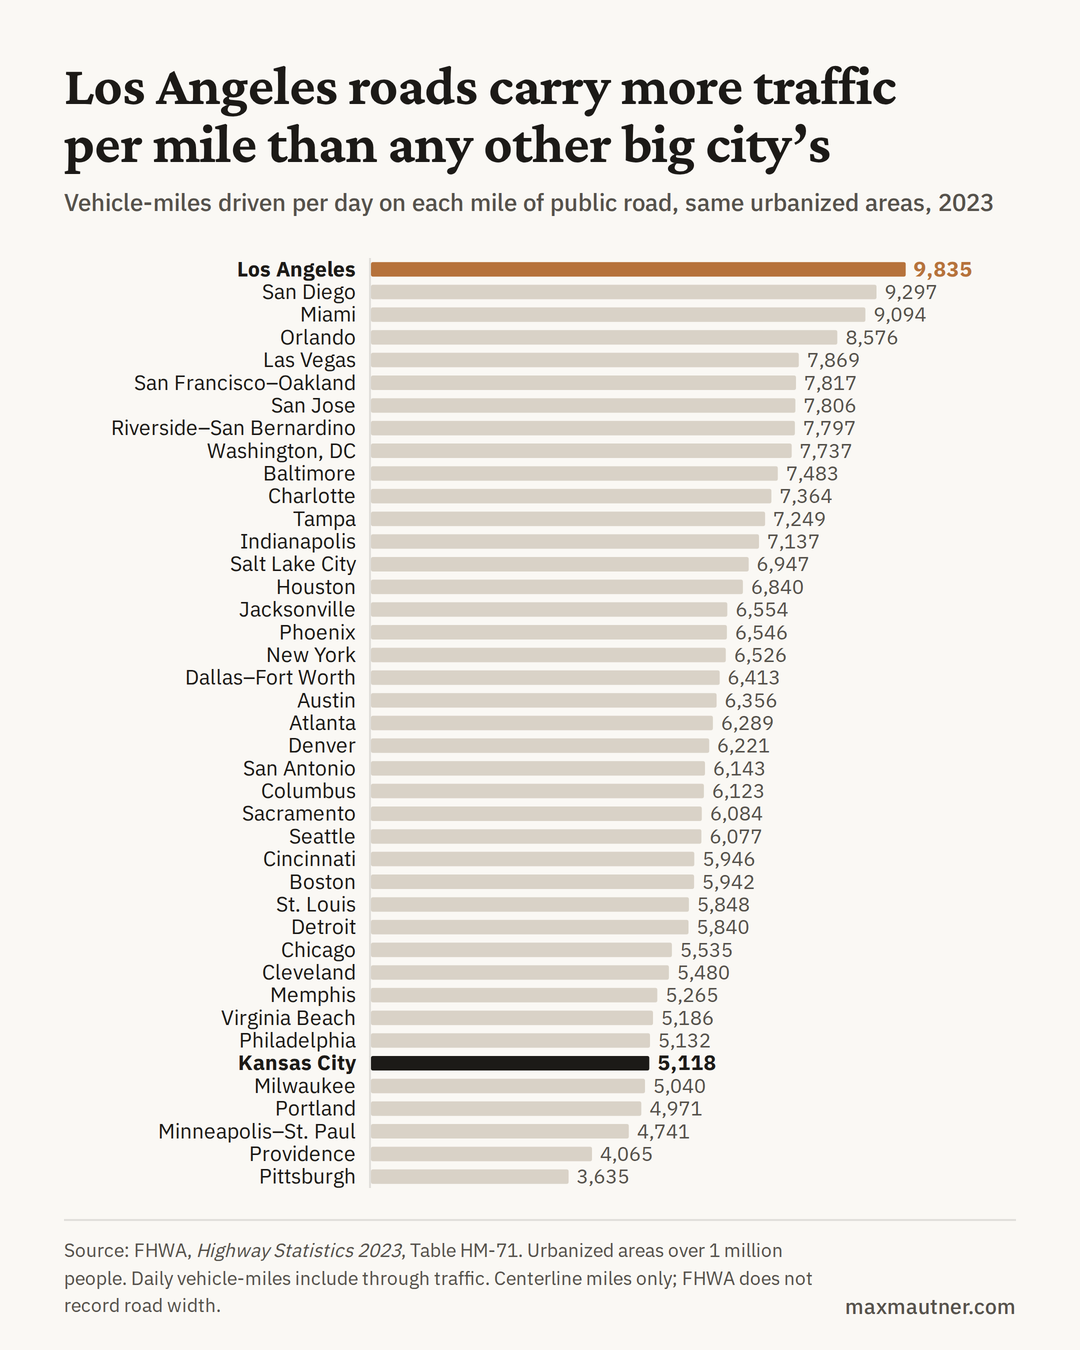
Los Angeles roads carry almost twice the traffic per mile that Kansas City’s do, and 2.7 times Pittsburgh’s. A small network driven hard wears out. A big network lightly driven wears out too, just more quietly, because asphalt also ages with sun and water whether anyone drives on it or not.
More road also comes with more driving. Atlanta’s roads log 35 vehicle-miles a day per resident while Los Angeles’s log 20.4
Pittsburgh, third on the first chart, is not a sprawl capital. The city has less than half of its 1950 population. Pittsburgh shows that road assets don’t scale down as people leave the area, and they don’t get cheaper to rebuild when fewer people are left to pay for them.
The ratio moves from the other direction too. Apartments on streets that already exist split the same miles among more households. The Homevoter Hypothesis explains why the people already living on those streets usually vote against the apartments.
Road upkeep is also only one of the costs of driving that drivers don’t fully pay. The rest, mostly crashes, comes to at least $2.15 trillion a year in the US, and every mile not driven takes a little off it. I broke that bill down in Paying for driving.
Correction, September 25, 2026: An earlier version of this post used FHWA’s 2023 table, whose population figures are from the 2010 Census; the figures and charts now use the 2024 table and 2020 Census populations, which leaves Los Angeles last but makes Miami, not Los Angeles, the metro with the most traffic per mile of road.
FHWA, Highway Statistics 2023, Table HM-20: 4,199,209 miles of public road, about 20 meters for each of roughly 335 million residents. Ireland’s total is from the Department of Transport’s 2018 road classification ↩
FHWA, Highway Statistics 2024, Table HM-71, urbanized areas over 1 million people, excluding Puerto Rico. Population is the 2020 Census; miles and travel are 2024. Data and code: github.com/mmautner/us-urban-road-mileage. Miles are centerline miles of all public roads; FHWA does not record road width, and local-road mileage is the least carefully inventoried category. Greater Southern California sums Los Angeles, Riverside-San Bernardino, Mission Viejo, Santa Clarita, Thousand Oaks, Simi Valley, Oxnard, Camarillo, Palmdale-Lancaster, Temecula-Murrieta, and Victorville: 17.5 million people and 41,078 miles. ↩
TRIP, Keeping California Mobile (2025). TRIP is funded partly by the road construction industry, and its roughness measure covers major roads only. ↩
Daily vehicle-miles from Table HM-71 (2024) divided by population. The count includes through traffic, not only residents’ trips. ↩
Enjoyed this post? Get new posts via email