Essay
California chose its housing shortage

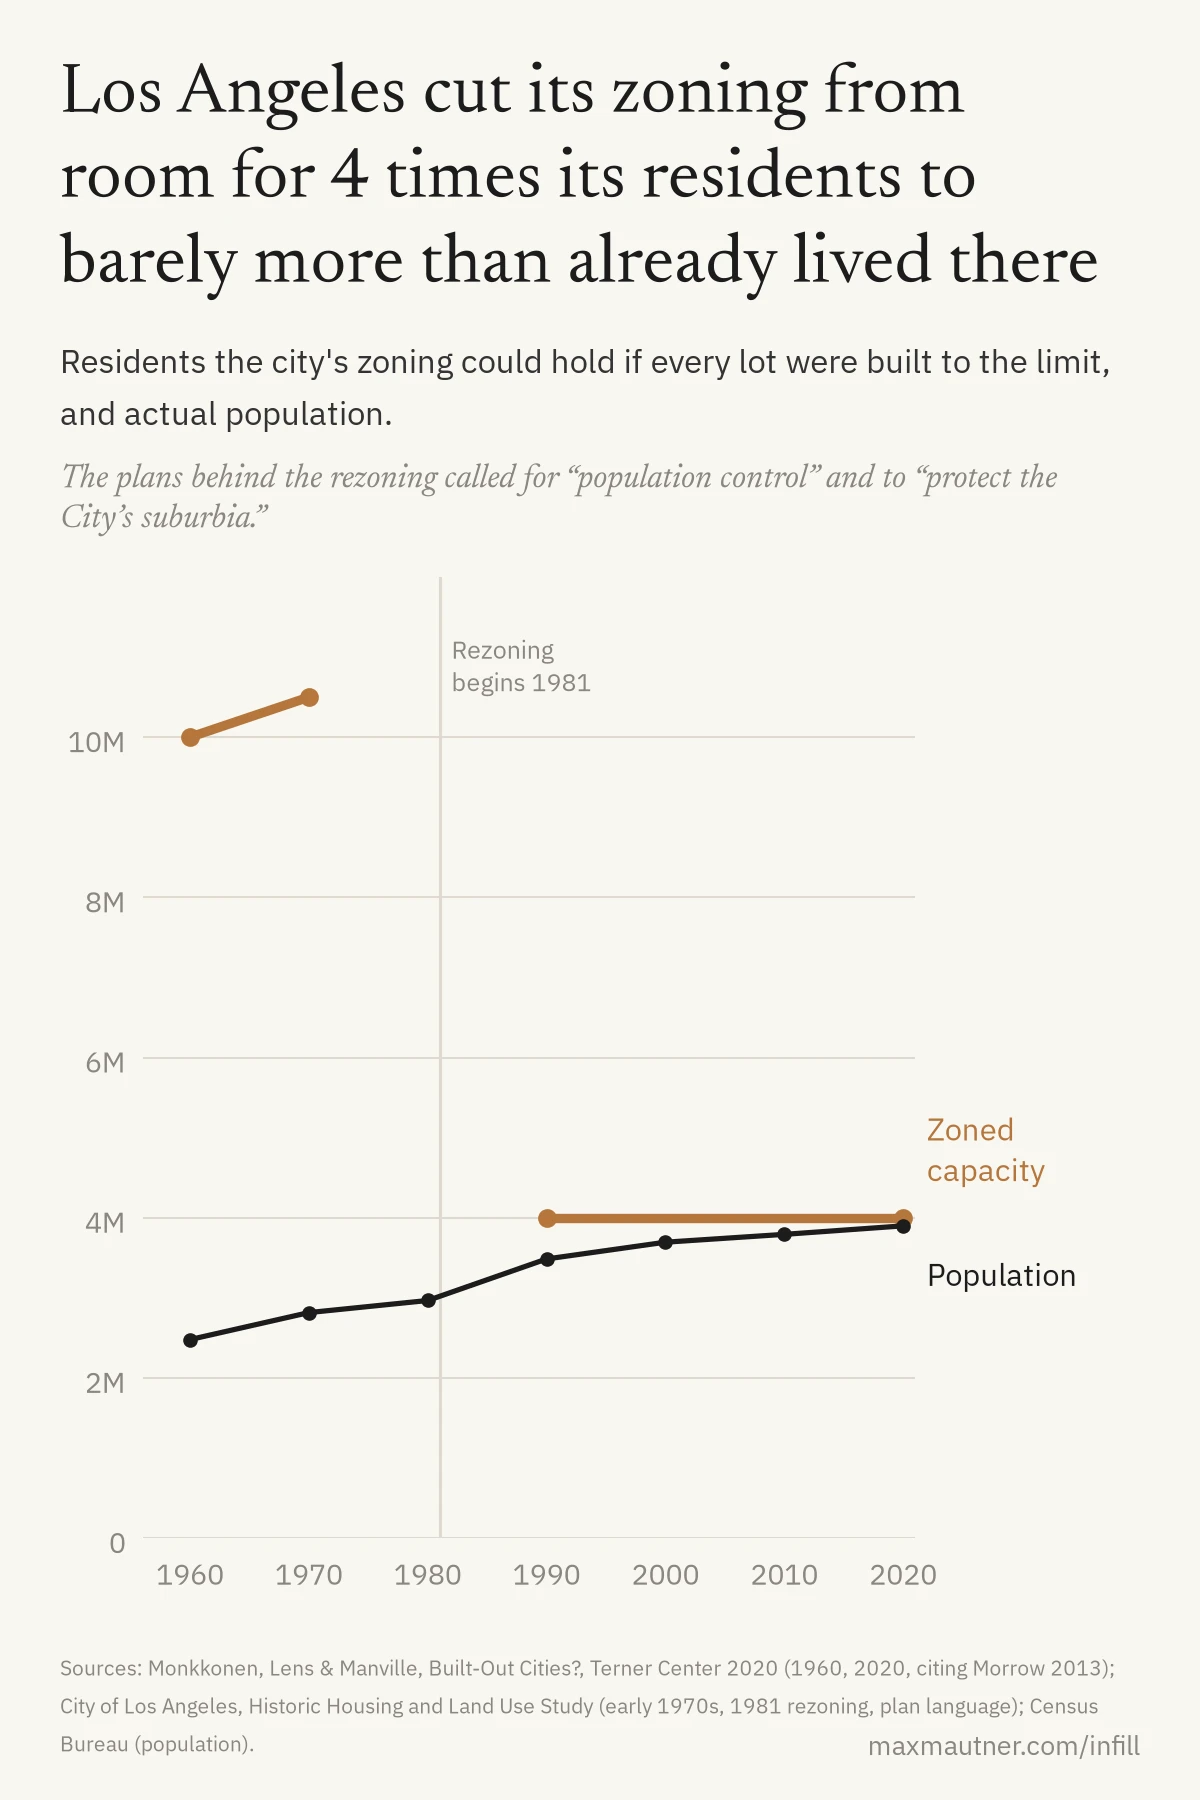
California’s housing shortage was a choice: its cities chose not to let existing neighborhoods grow, and the homeowners who made that choice profit from it. In 1960, Los Angeles zoning had room for ~10 million people. By 1990 it had room for ~4 million, after homeowners pushed the city to rezone neighborhoods where duplexes and apartments had been allowed so only single-family homes could go up. Most residents had told the city they wanted it to keep growing. The city didn’t run out of land; it rewrote its rules for the minority that didn’t want growth. As one developer put it in 1980, “everybody knows that Los Angeles desperately needs housing, but they don’t want it built around them.”
It wasn’t just LA: across California, homebuilding per resident fell to a fifth of its 1970s rate by the 2010s. People who already had homes kept them. Grown children stayed with their parents, and adults who wanted places of their own found roommates instead. Many put off having kids: the median first-time homebuyer nationally is now 38, and California’s fertility rate has fallen from 17th among states to 43rd since 2008. Since 1980 California homes have held more people on average while homes in the rest of the US held fewer.
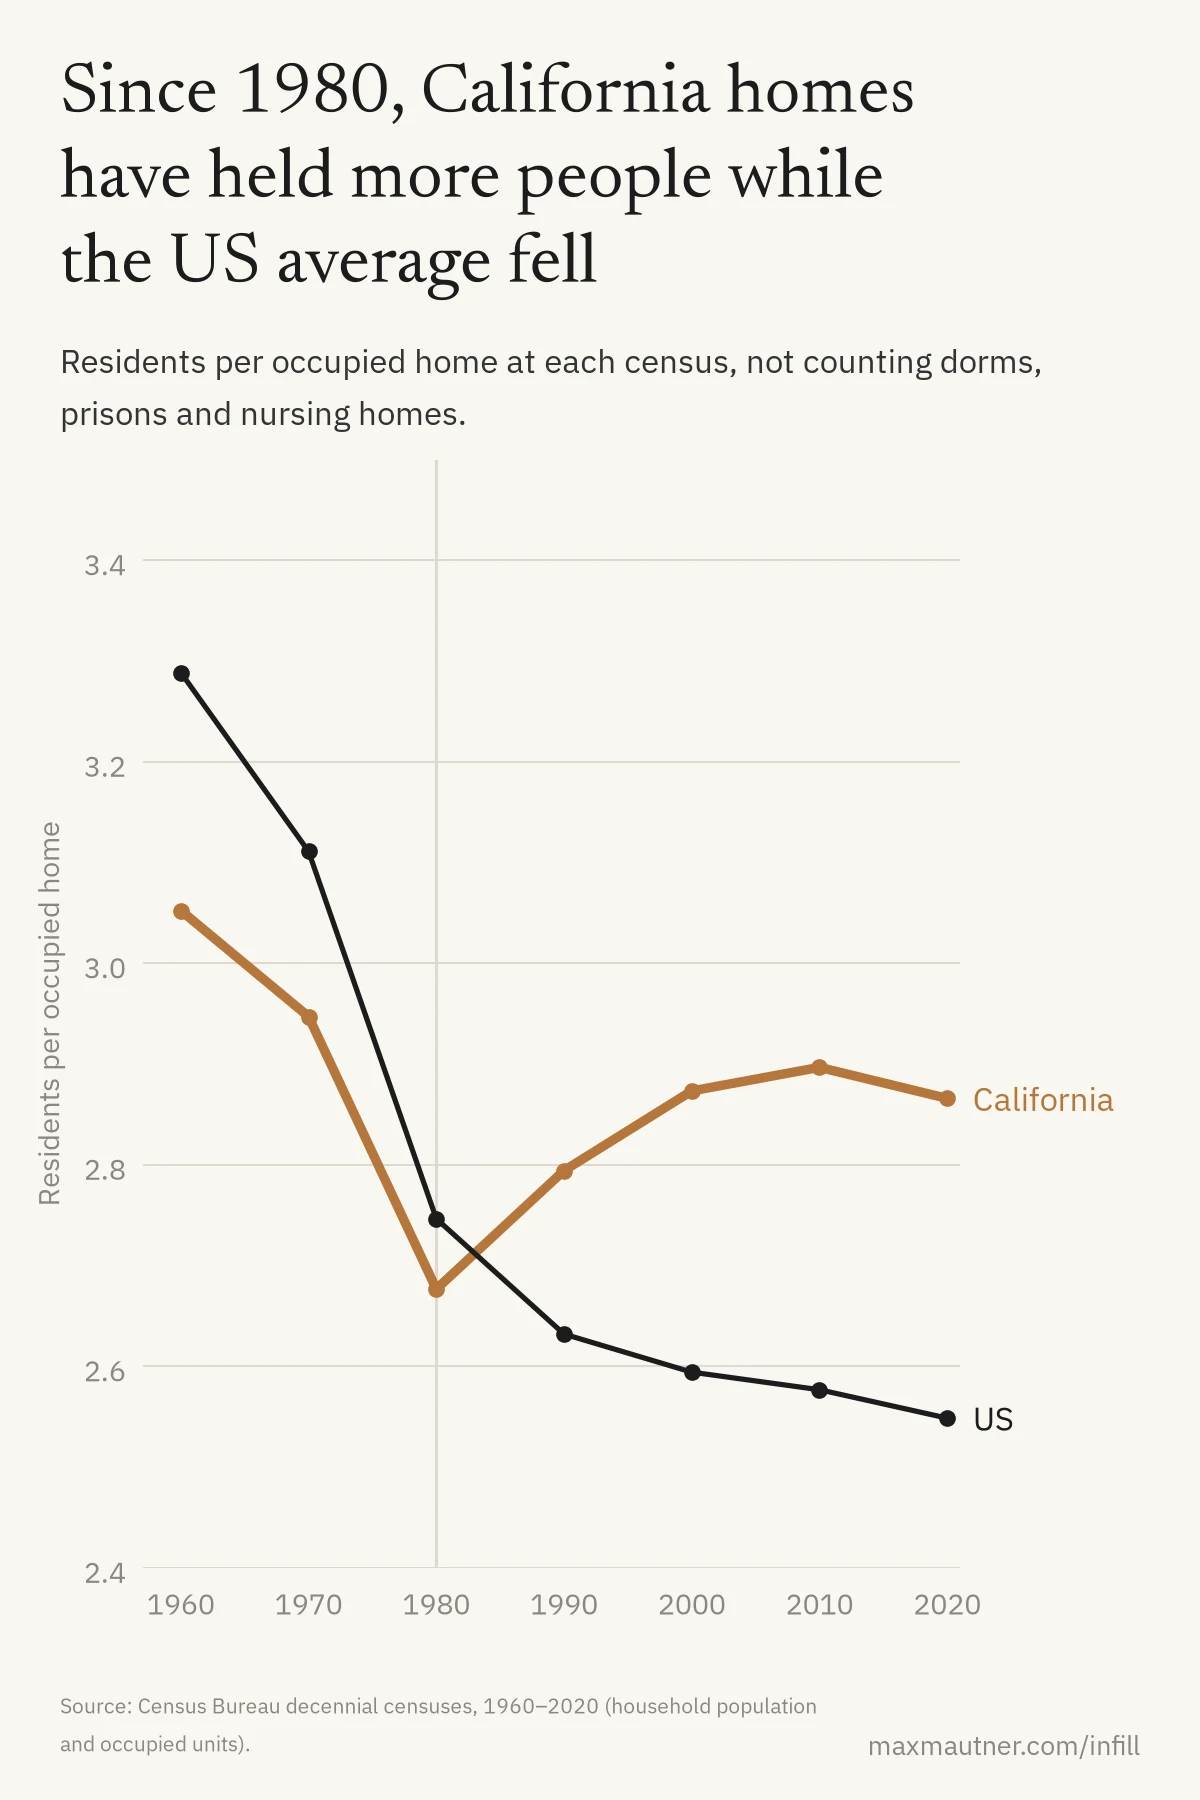
That’s what happens when a state stops adding homes as fast as it adds people. In the 1980s California added ~3.4 residents for every additional occupied home, when the average home held 2.68. The homes it already had took in the difference, so the shortage stayed out of sight for anyone already housed. In the 2010s California grew more slowly than in any decade on record, and the average dipped slightly.
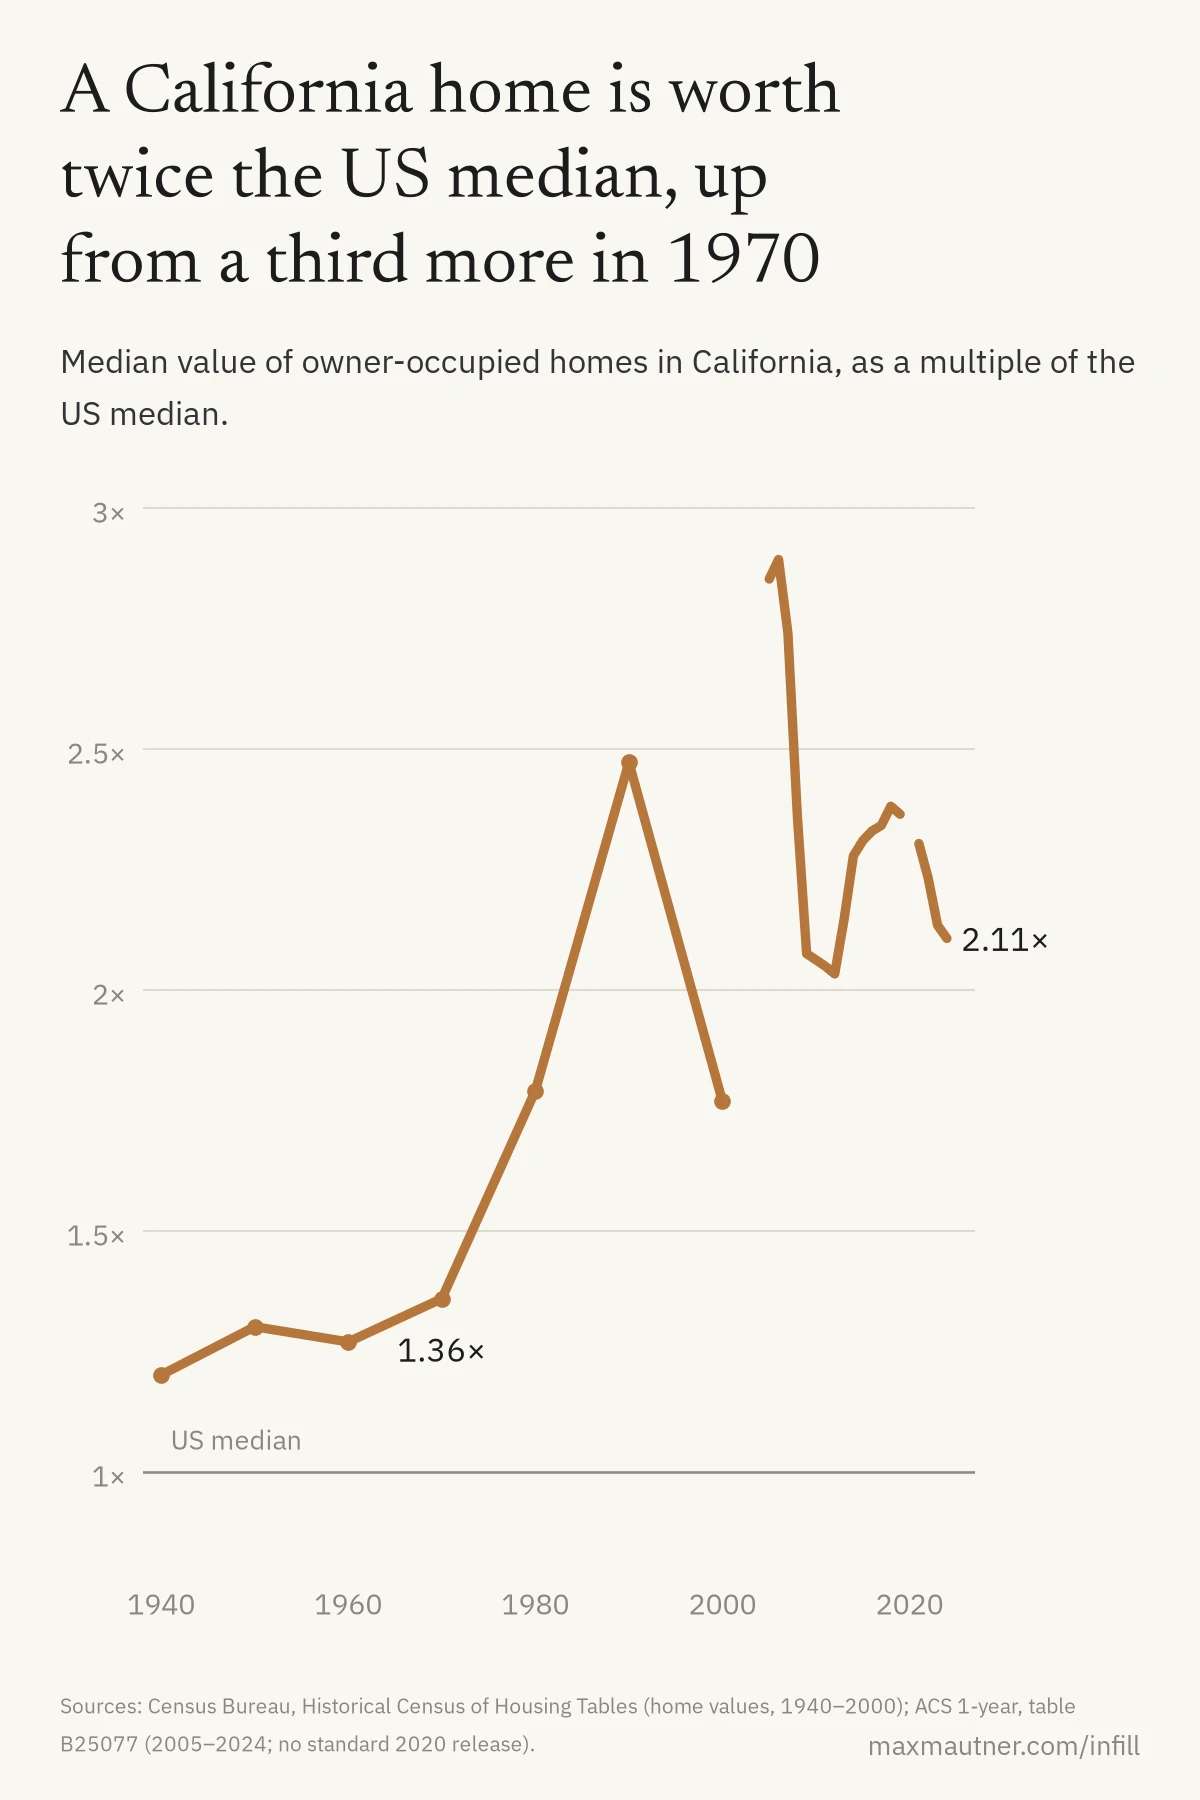
The cost showed up in prices. In 1970 the median California home was worth about a third more than the median US home. By 2024 it was worth more than twice as much: $759,500 against $360,600, up from $23,100 against $17,000. Los Angeles’s own planning department says it plainly: shortages “benefit existing homeowners at the expense of renters and would-be homebuyers through rising prices.” Counting the cost of living, California now has the highest poverty rate of any state, tied with Louisiana.
A home is any house, apartment or mobile home, so a 200-unit apartment building counts as 200 homes. I count a home as “infill” if its census tract had at least 425 homes per square mile when the decade began, the density at which the Census Bureau starts drawing urban areas from individual blocks. That’s only ~2/3 of a home per acre, so it includes large-lot suburbs as well as city neighborhoods. The infill drop holds at stricter and looser cutoffs. The counts come from the Census Bureau’s year-built survey data for California’s ~9,100 tracts, which only covers homes still standing. Homes built in the 1970s have had 50 years to be torn down, so the real drop is steeper than the charts show. Population is from the decennial census.
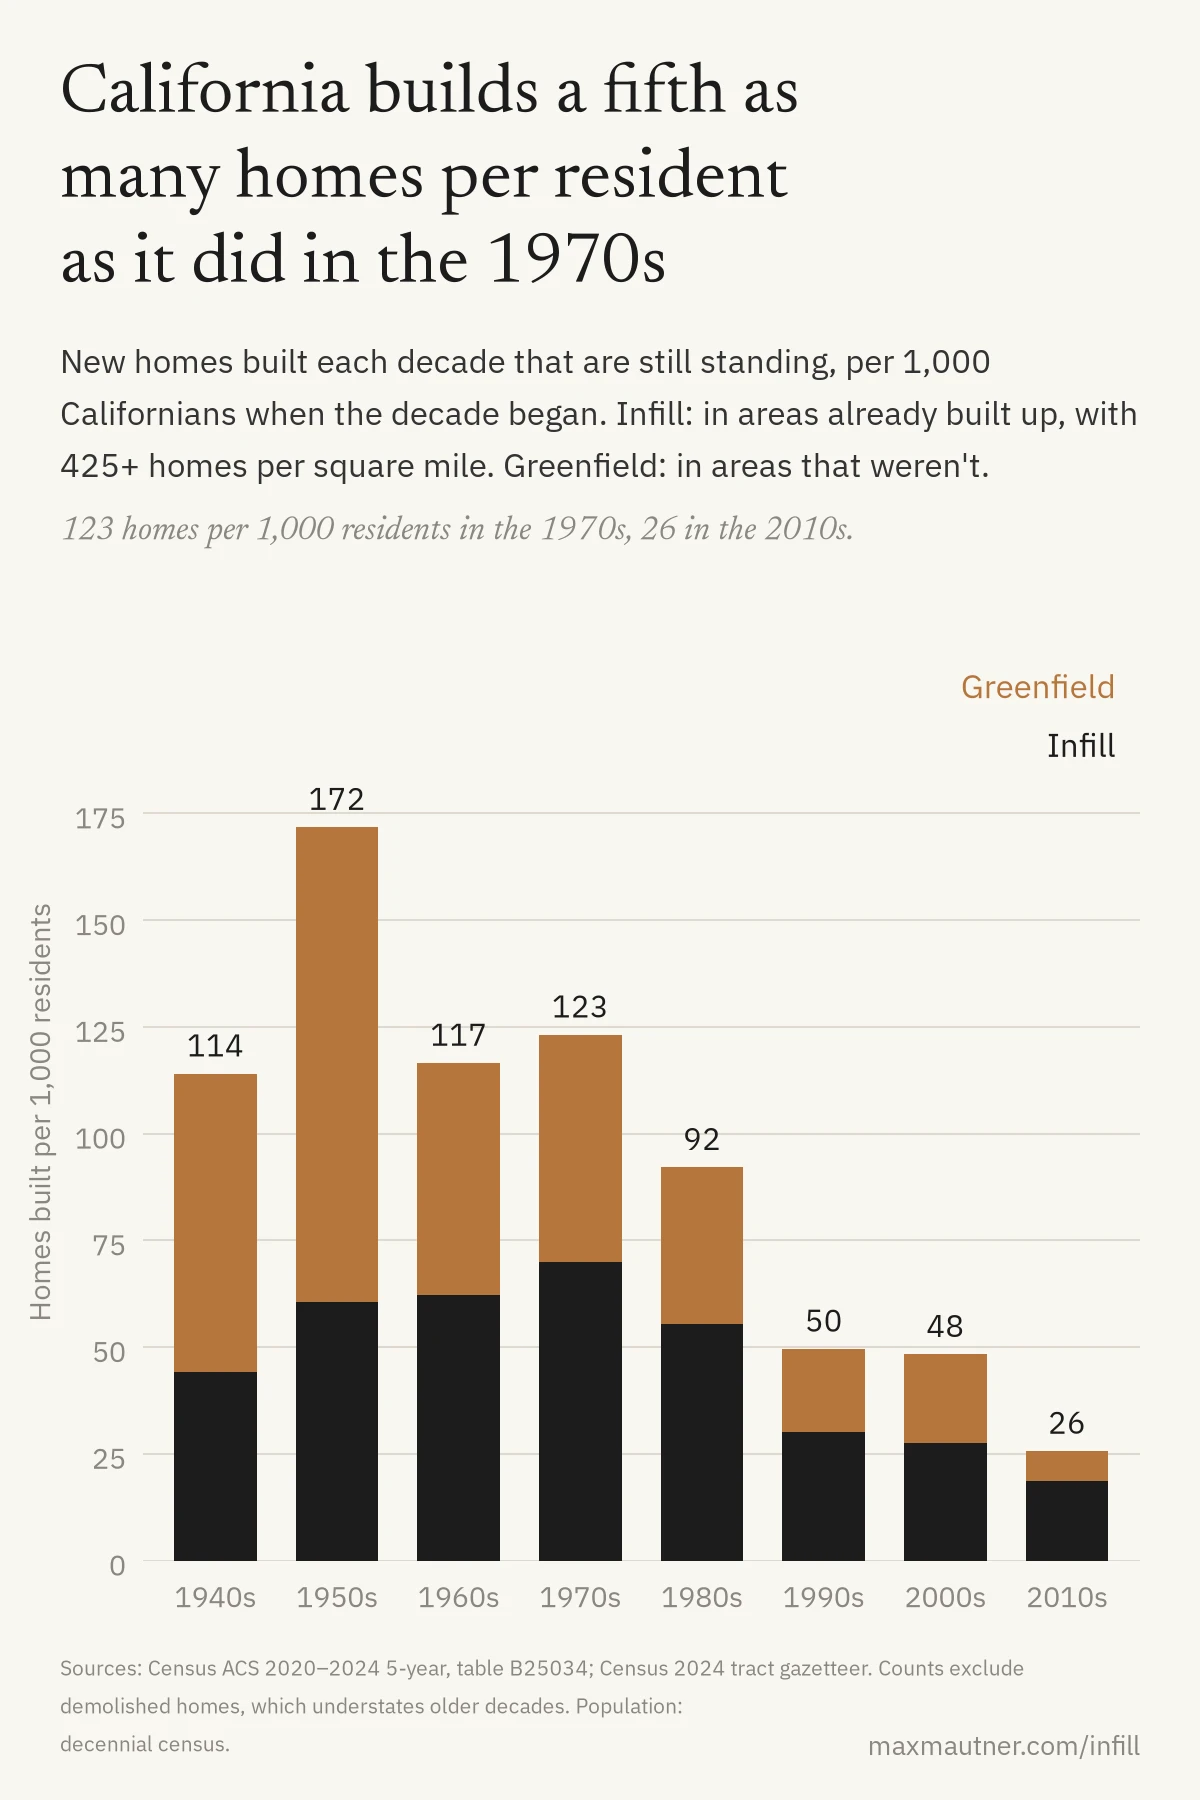
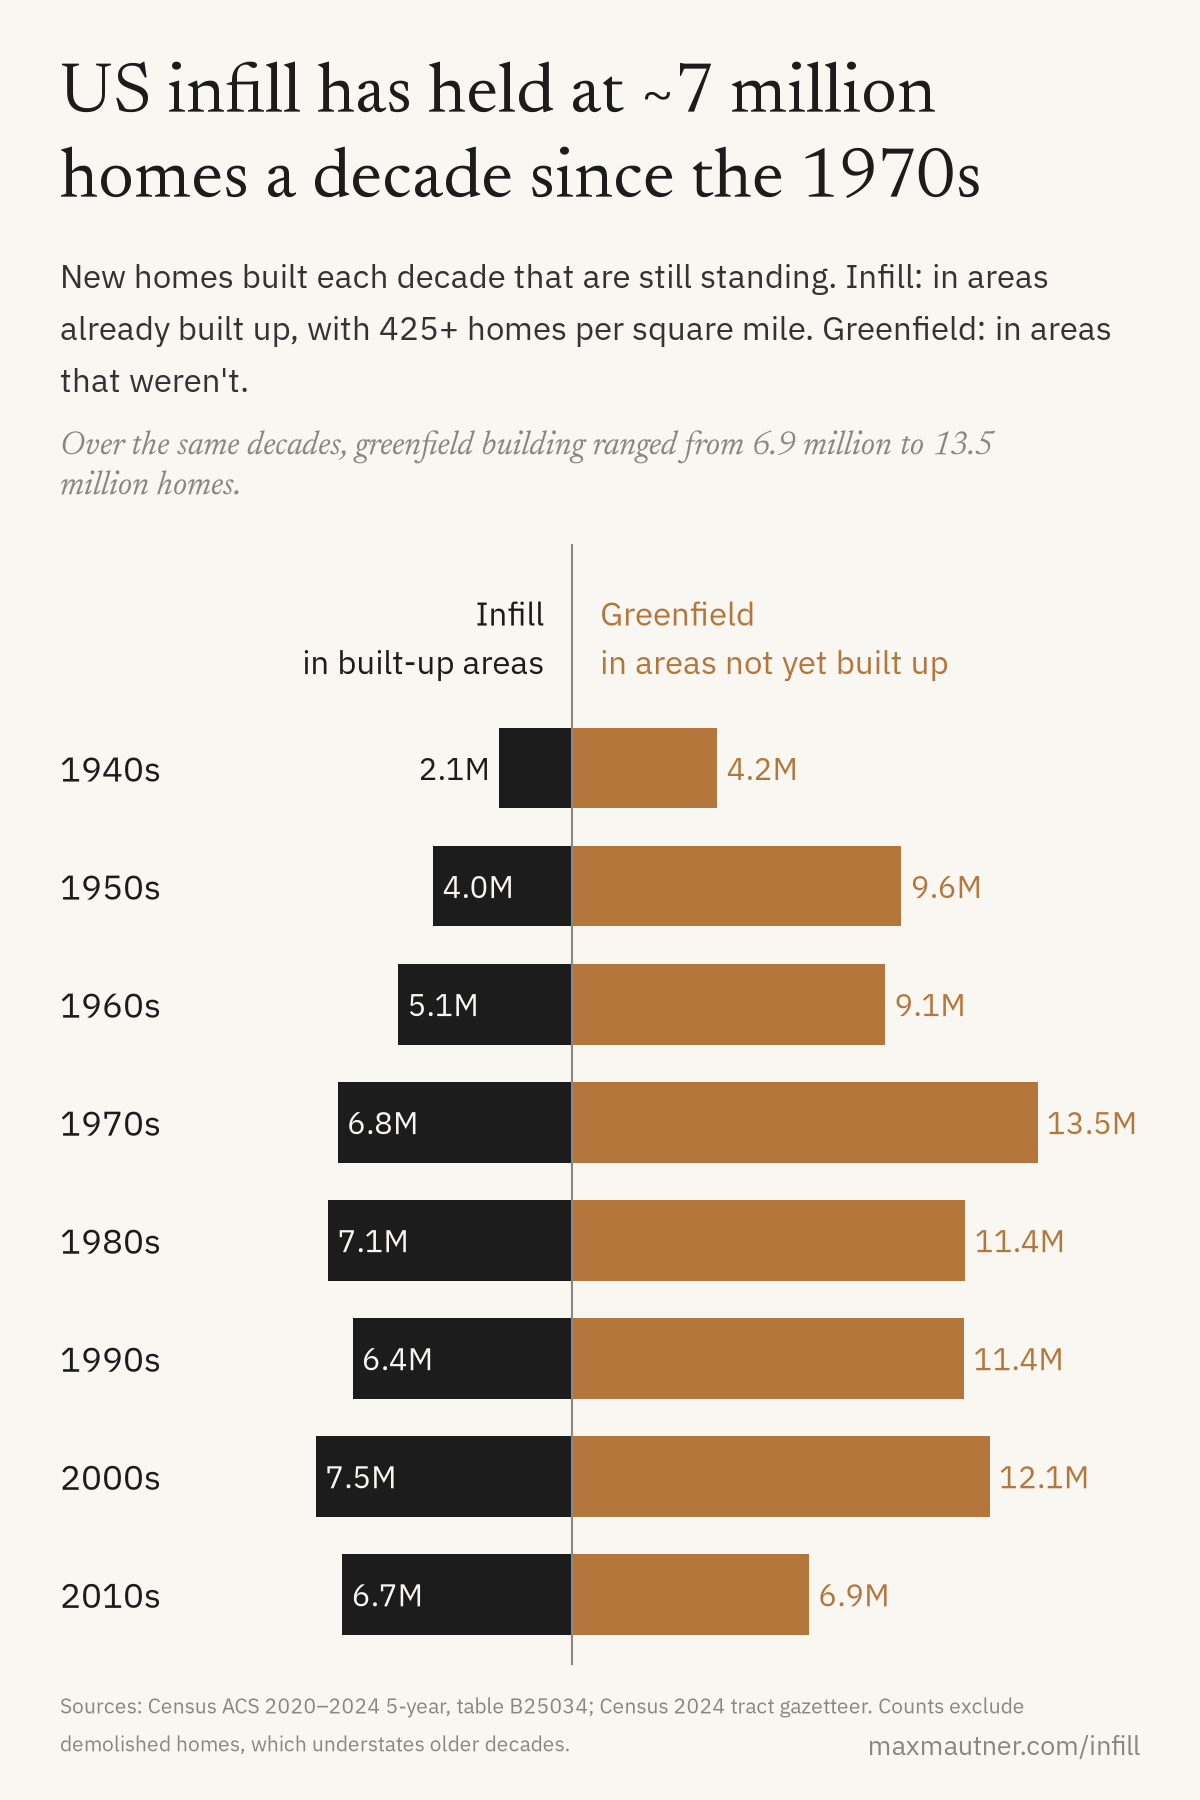
Both kinds of building fell. Building on open land fell from ~1.1 million homes in the 1970s to ~260,000 in the 2010s, and infill halved, from ~1.4 million to ~700,000. California has built more in existing neighborhoods than on open land in every decade since the 1960s, unlike the US as a whole, where open land led in every decade since the 1940s. Since open-land building fell harder, infill’s share of new homes rose from ~57% in the 1970s to ~72% in the 2010s.
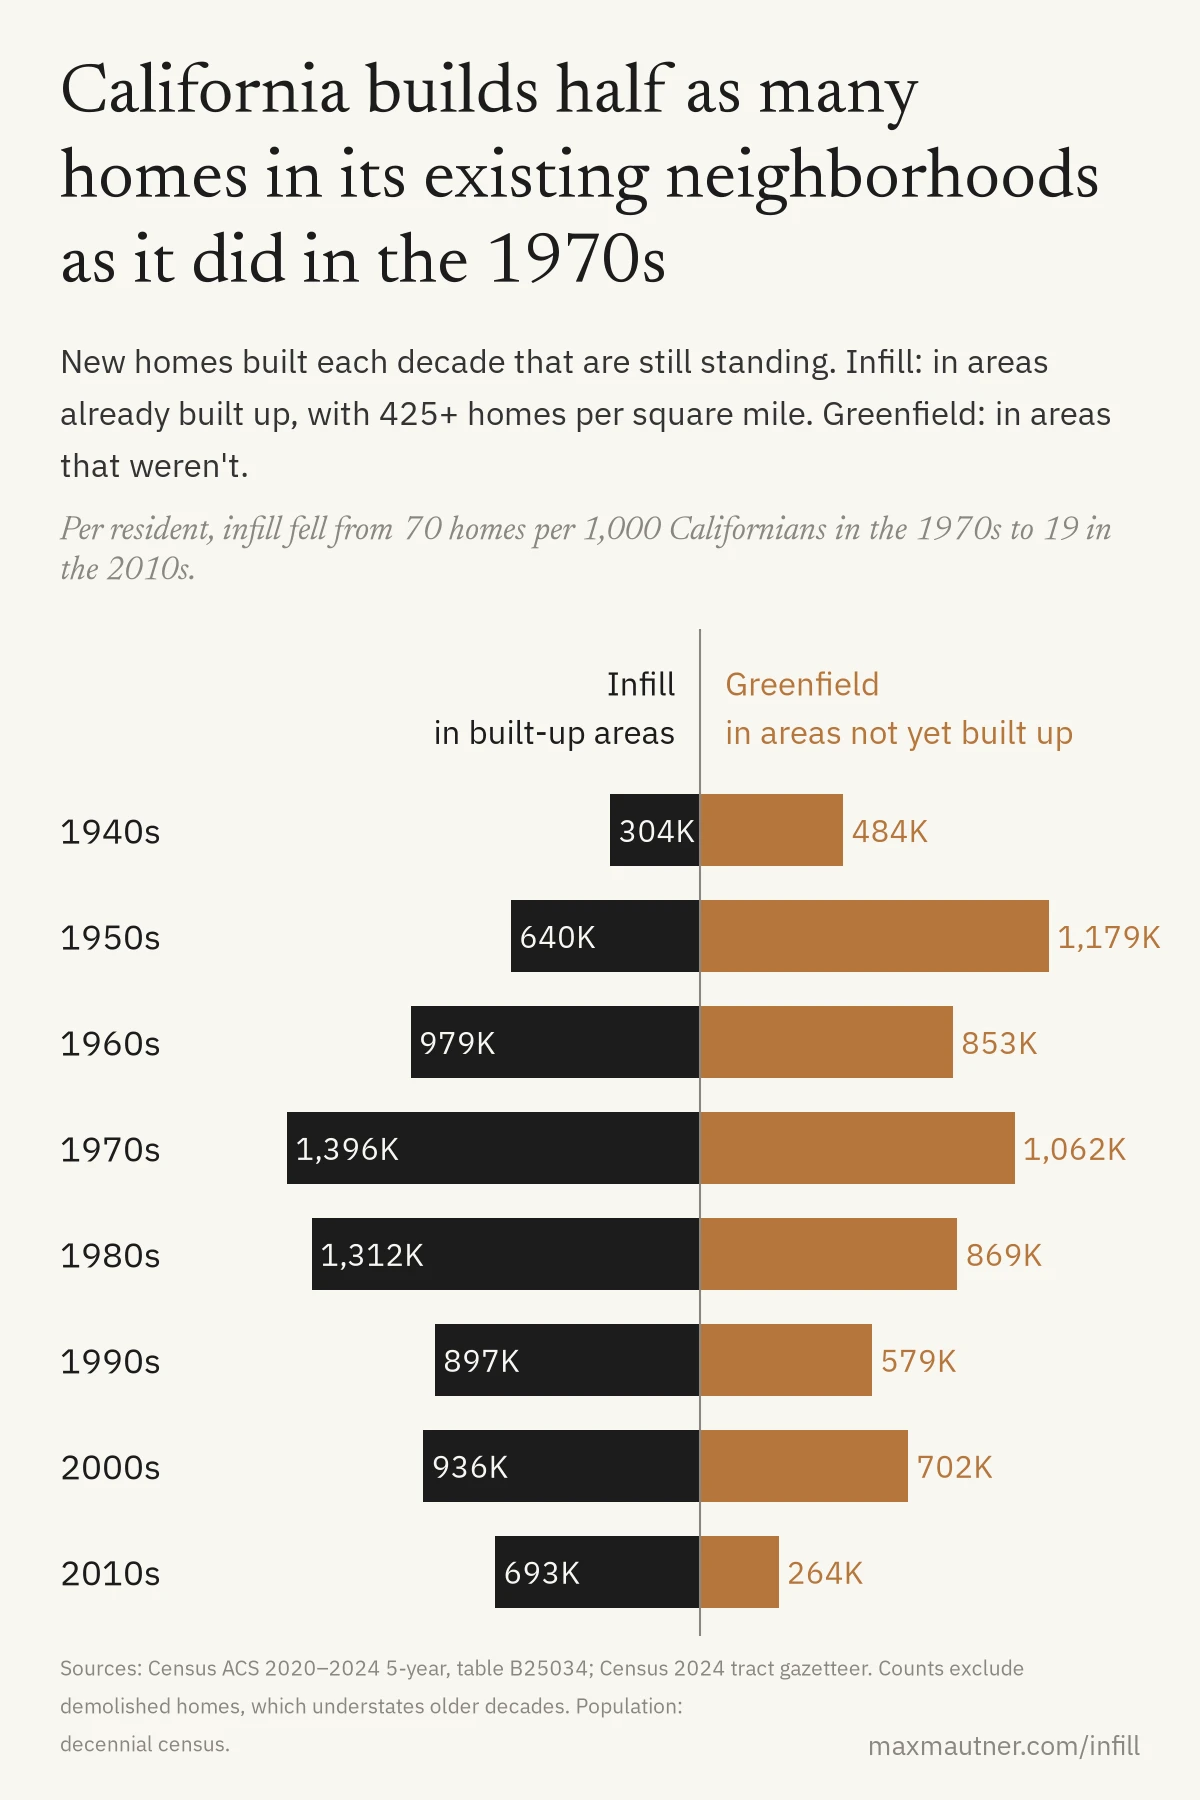
The biggest drop in homes built came in the 1990s, ~700,000 fewer than in the 1980s. Infill and open-land building each fell by a third, as the state lost over 720,000 jobs in a recession and permits for new homes fell from over 200,000 a year to under 100,000. The jobs came back and the homebuilding never did. The 2000s housing boom added about as many infill homes as the recession decade, and the 2010s added fewer.
Some of the fall on open land since the 1970s is geography: the state’s Legislative Analyst’s Office found very little vacant land left on the coast. Some is another choice: over two-thirds of cities and counties in coastal metros have adopted growth controls explicitly aimed at limiting housing growth, such as caps on how many homes can be built each year.
Zoning kept existing neighborhoods from taking up the slack. When Los Angeles surveyed residents about its future in the late 1960s, ~60% wanted the city to keep growing, and almost 90% of Black respondents did. The community plans that came out of that process called instead for “population control” and to “protect the City’s suburbia”. White homeowner groups on the Westside and in the San Fernando Valley got their neighborhoods downzoned, and those limits are still in place. Denser building was steered into poorer neighborhoods and neighborhoods of color instead.
A rezoning that began in 1981 wrote those plans into law, just as building across California started to fall. It cut the city’s room from ~10.5 million people to ~4 million when ~3 million already lived there. Los Angeles was still at roughly that capacity in 2020.
The state’s biggest fix so far is backyard homes. Since 2016 it has taken away cities’ power to block accessory dwelling units, and an ADU needs no rezoning and no teardown: it goes in a backyard or garage that’s already there. By 2023 builders were completing over 23,000 a year, and ADUs are now 1 in 4 new homes California permits. At that pace they add ~230,000 homes a decade, about 6 for every 1,000 Californians. Infill fell from 70 homes per 1,000 Californians in the 1970s to 19 in the 2010s, so ADUs make up ~6 of that 51-home drop.
So far the census survey shows no shift: in its 2020–2024 responses, infill was the same ~72% of new homes as in the 2010s. The survey dates a home by when its building first went up, so an ADU made from an old garage counts as an old home and never appears in the 2020s column. California has twice the people it had in 1970, so building infill at the 1970s rate of 70 homes per 1,000 Californians would take ~2.8 million homes a decade, up from ~700,000 in the 2010s. ADUs at their 2023 pace cover ~230,000 of the missing ~2.1 million. The rest has to come from multifamily buildings in those same neighborhoods, the kind Los Angeles zoned out between 1960 and 1990.
The charts are generated by this code, which lists every input and its source.
Enjoyed this post? Get new posts by email.