Essay · TRANSPORTATION
Who lives without a car in the Bay Area

~1 in 10 Bay Area households has no car, ~269,000 households across the 9 counties, according to the Census Bureau’s American Community Survey microdata for 2020-24. The share has barely changed since 2012. San Francisco is home to 41% of them.
Households without a car are a far smaller group than people who don’t drive. In When Driving Is Not an Option, Anna Zivarts writes that 1 in 3 people in the United States has no driver’s license, and federal licensing and population counts agree (~30%, children included). Many of them live with a car someone else drives: children, older adults who have stopped driving, people whose disabilities rule it out. The Census data counts them as car-free only when their whole household has no vehicle.
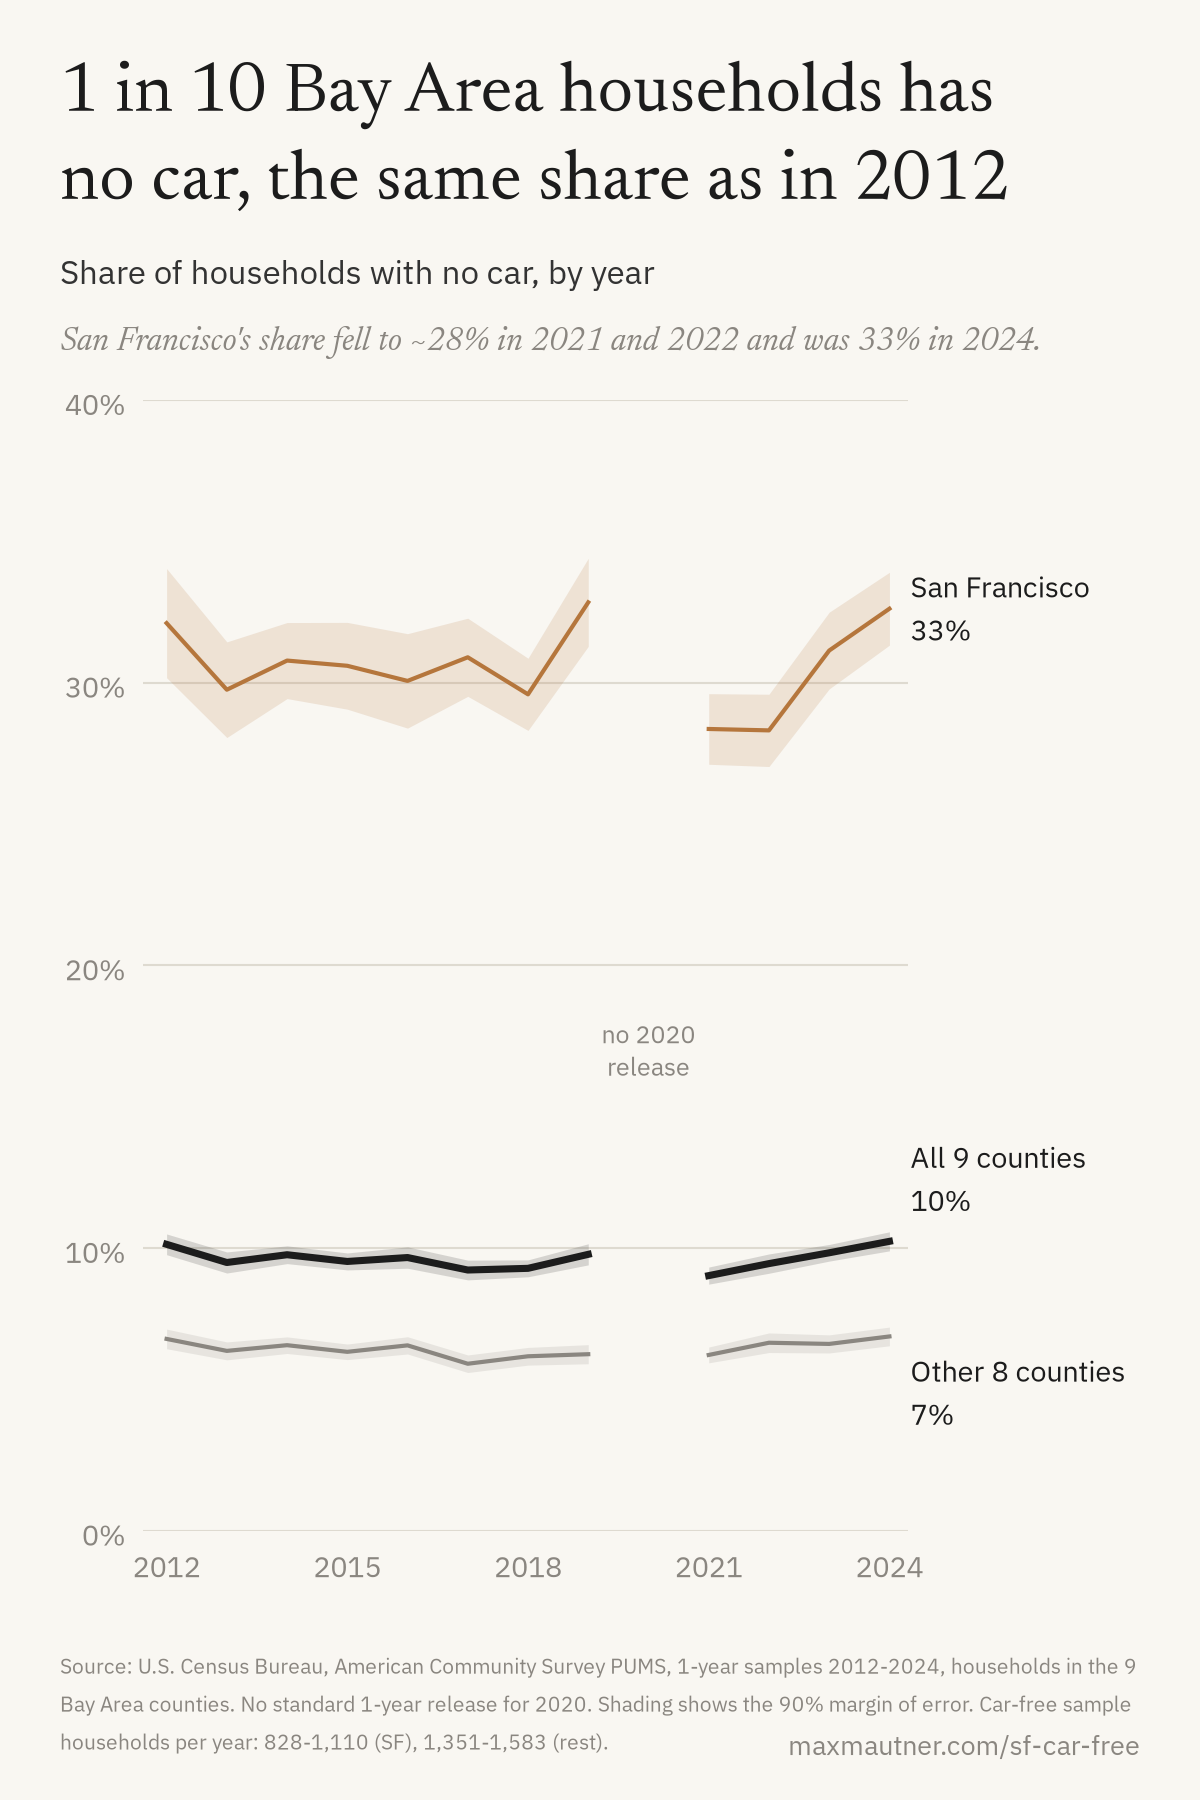
Seniors head more car-free households than any other group, and families with kids the fewest. Most car-free households are 1 person living alone, and half get by on less than $50k a year.
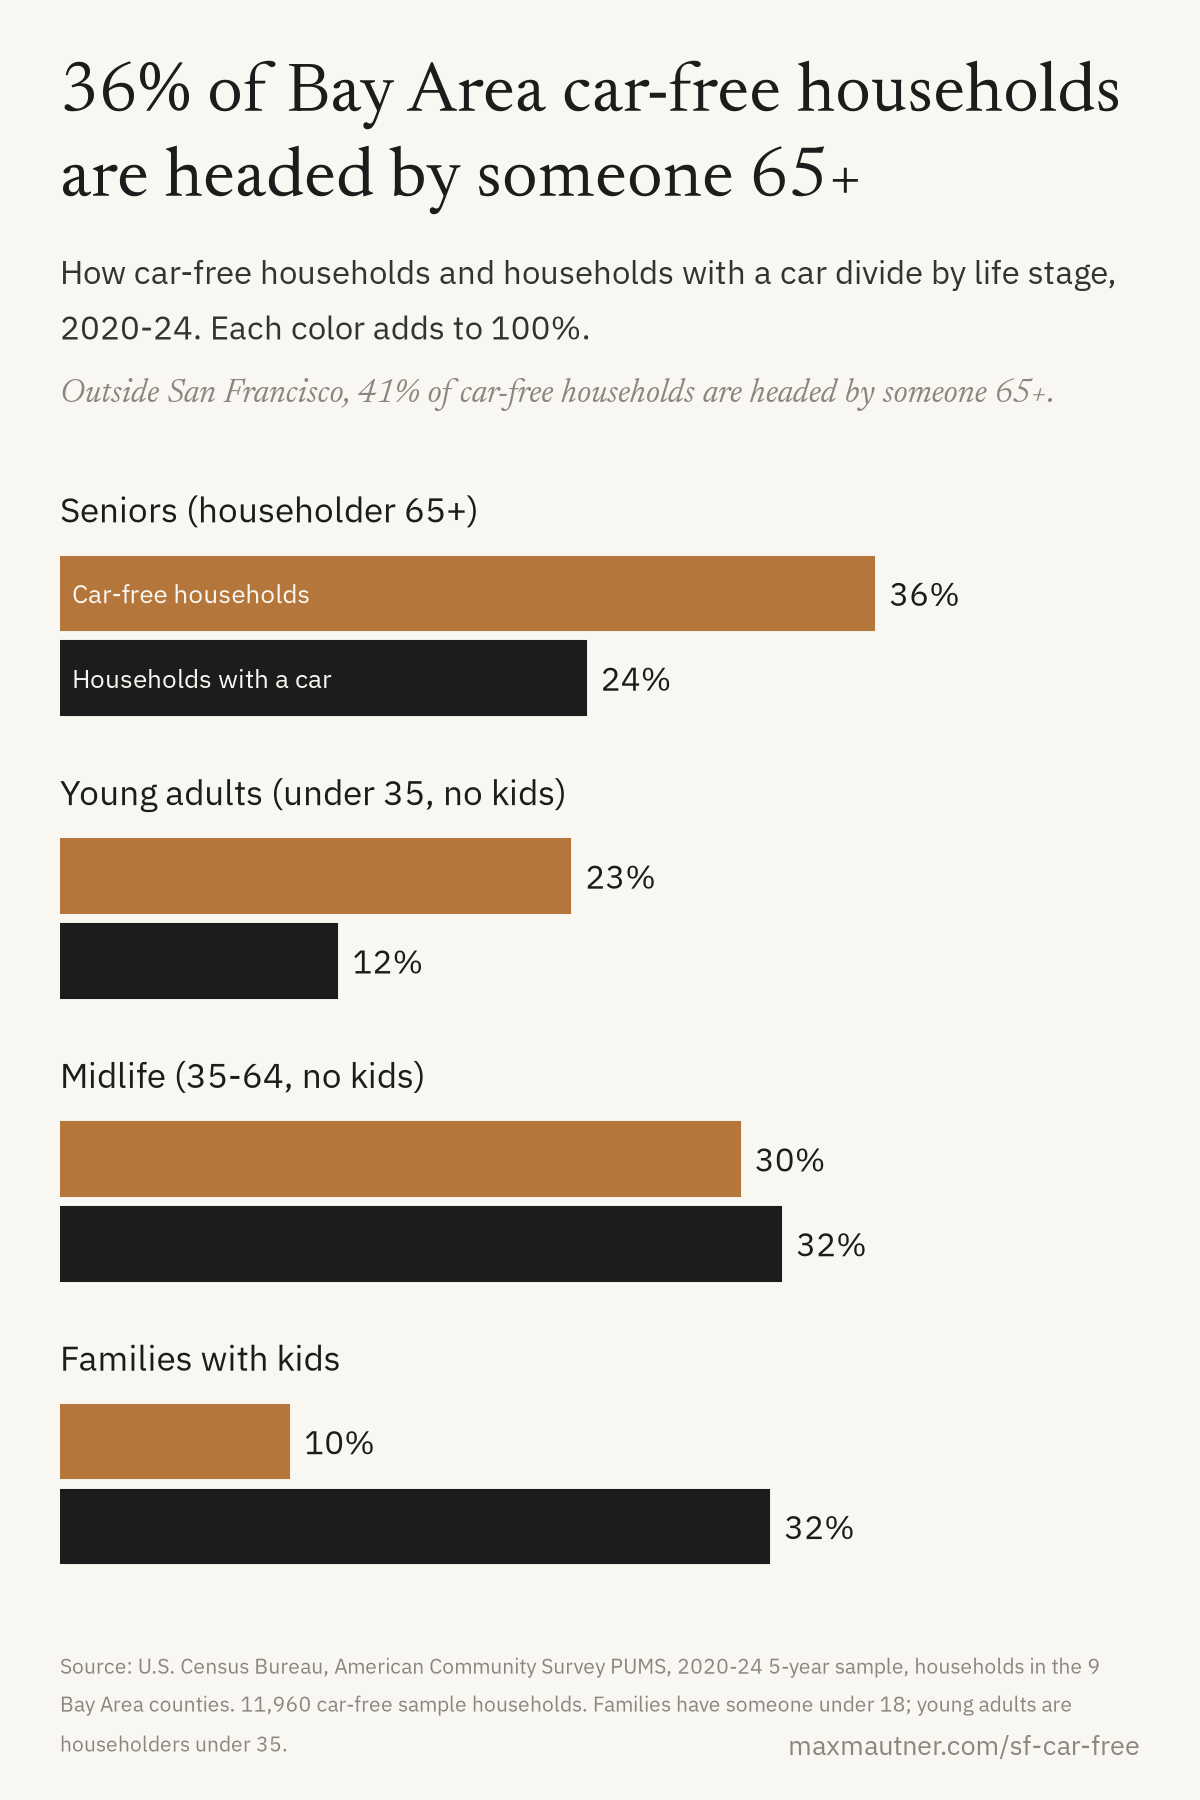
Outside San Francisco, a senior household is as likely to go without a car as a young-adult household, and among households headed by someone 85+, ~3 in 10 do. San Francisco families with kids go car-free about as often as young adults elsewhere in the region.
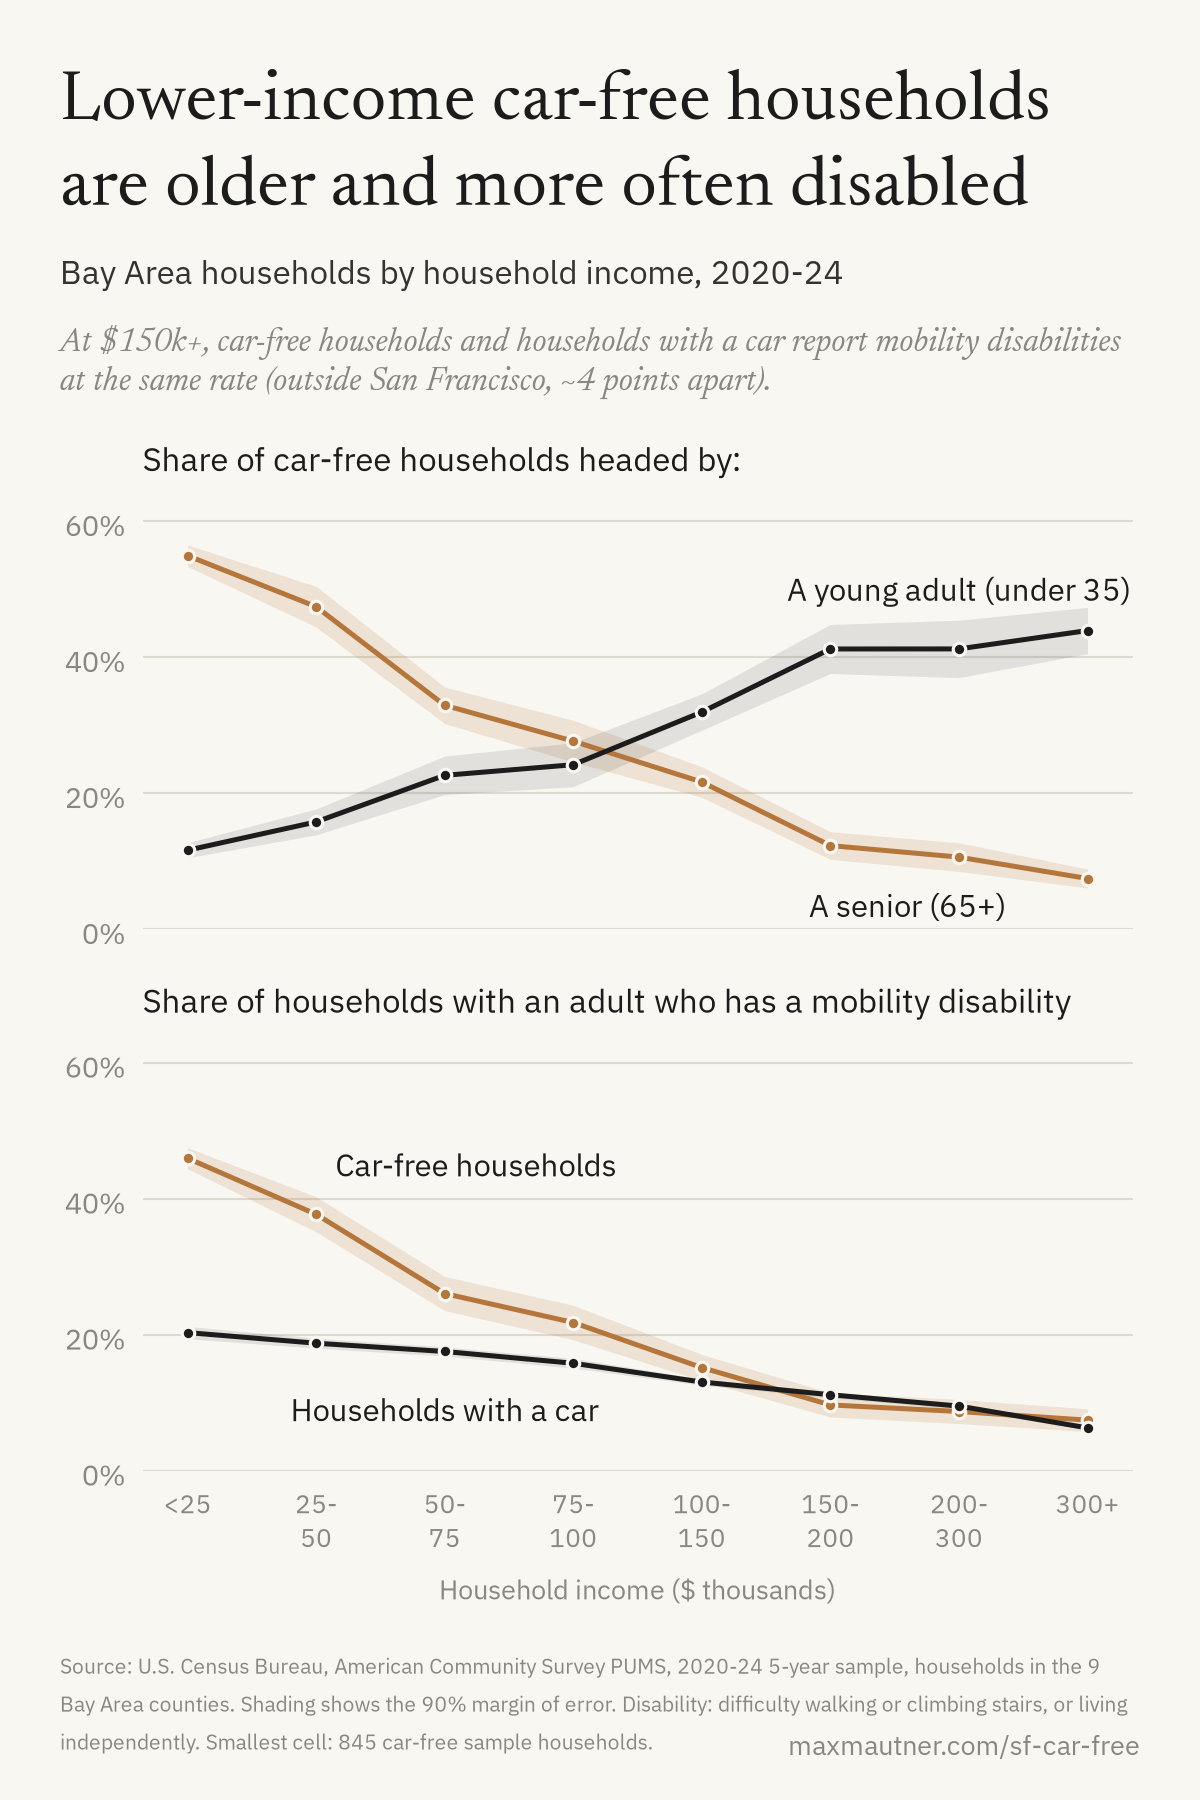
At the bottom of the income scale, car-free households are mostly seniors, usually with no one working, and often with someone who has trouble walking or living independently. At the top they are younger, college-educated and employed, and no more likely than car owners to include someone with a disability, though outside San Francisco a small gap remains. The survey doesn’t ask why a household has no car, so “by choice” and “by constraint” are inferences from income, age and disability.
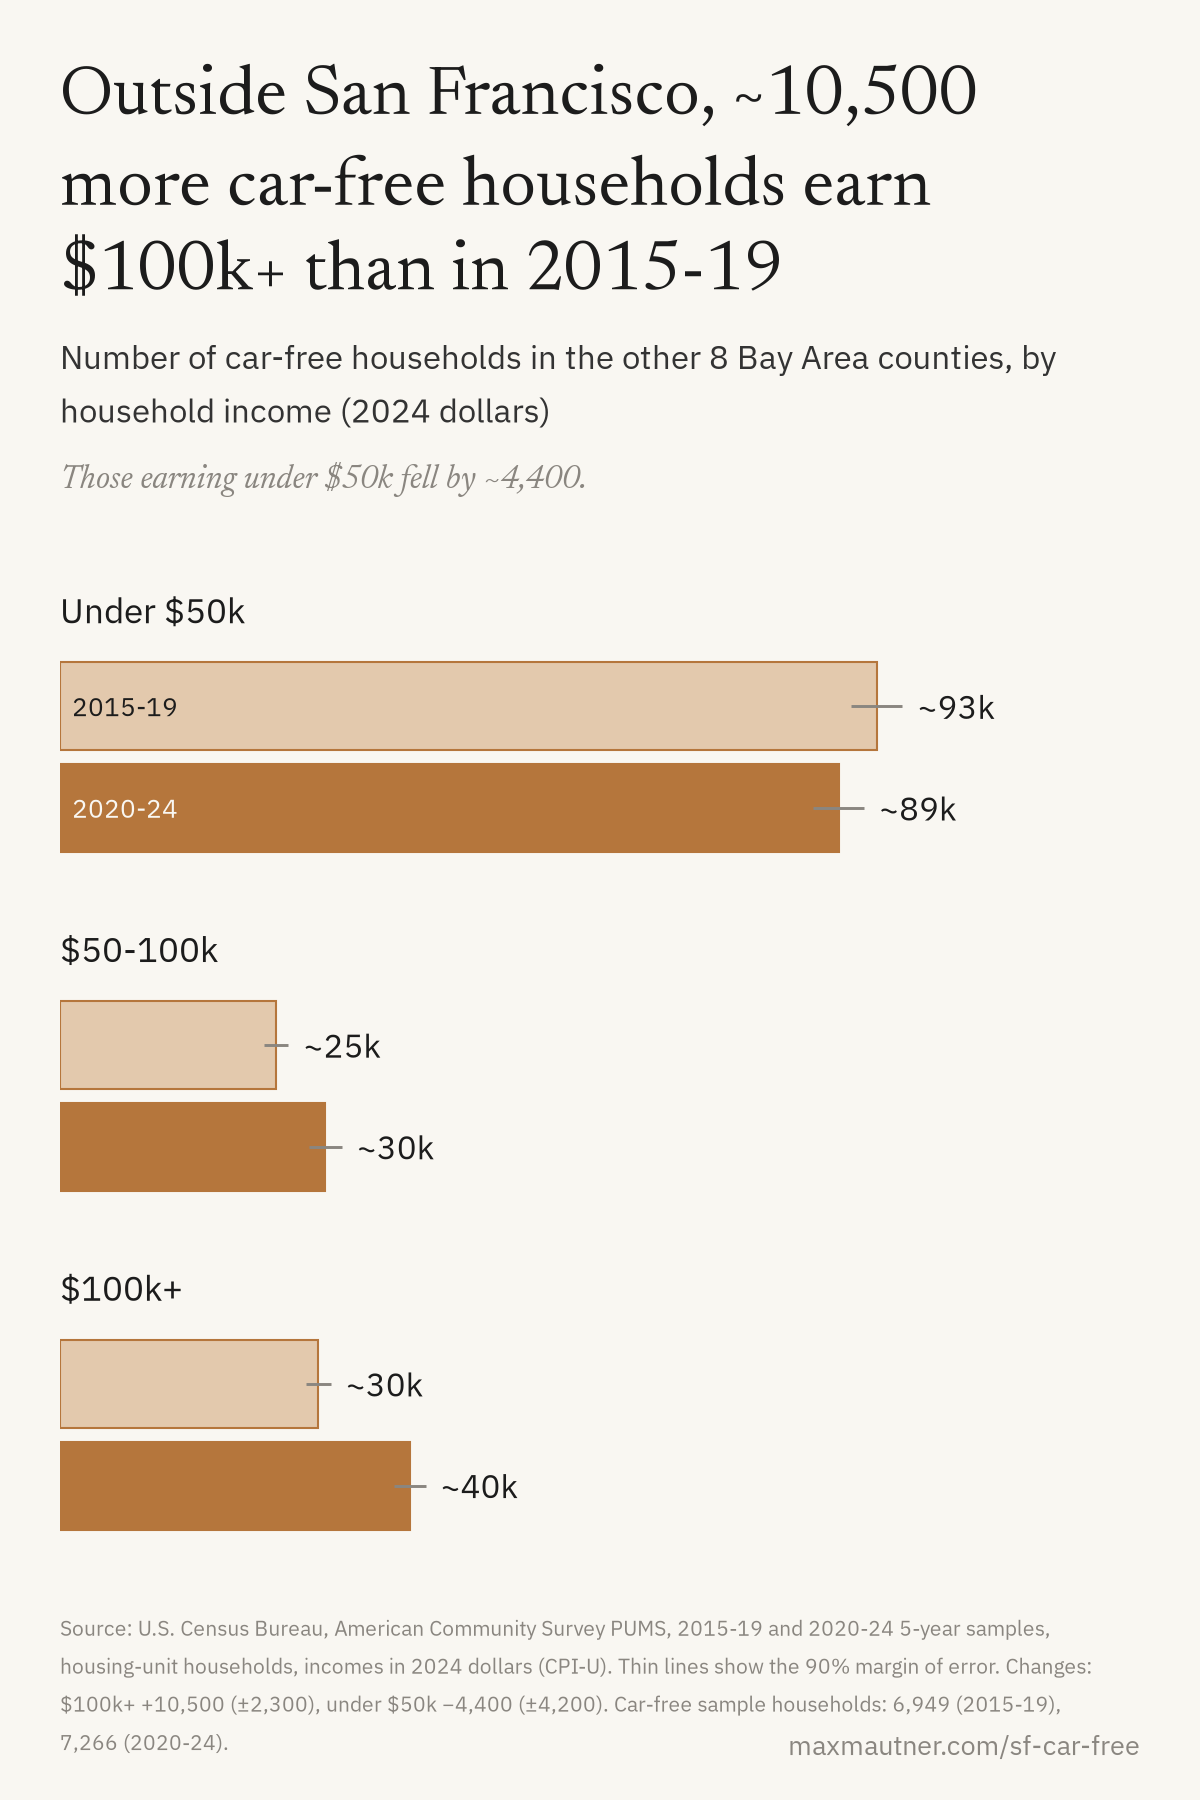
Between the 2015-19 and 2020-24 samples, the car-free population outside San Francisco got richer. Car-free households earning $100k+ grew ~35%, while those under $50k slipped. Part of that is Bay Area incomes rising faster than inflation, which moves every household up the brackets, but the share of households going without a car also rose at most middle and upper incomes. Seniors went the other way: a smaller share of them live without a car than before, which fits newer cohorts of seniors driving more, though no survey question measures it.
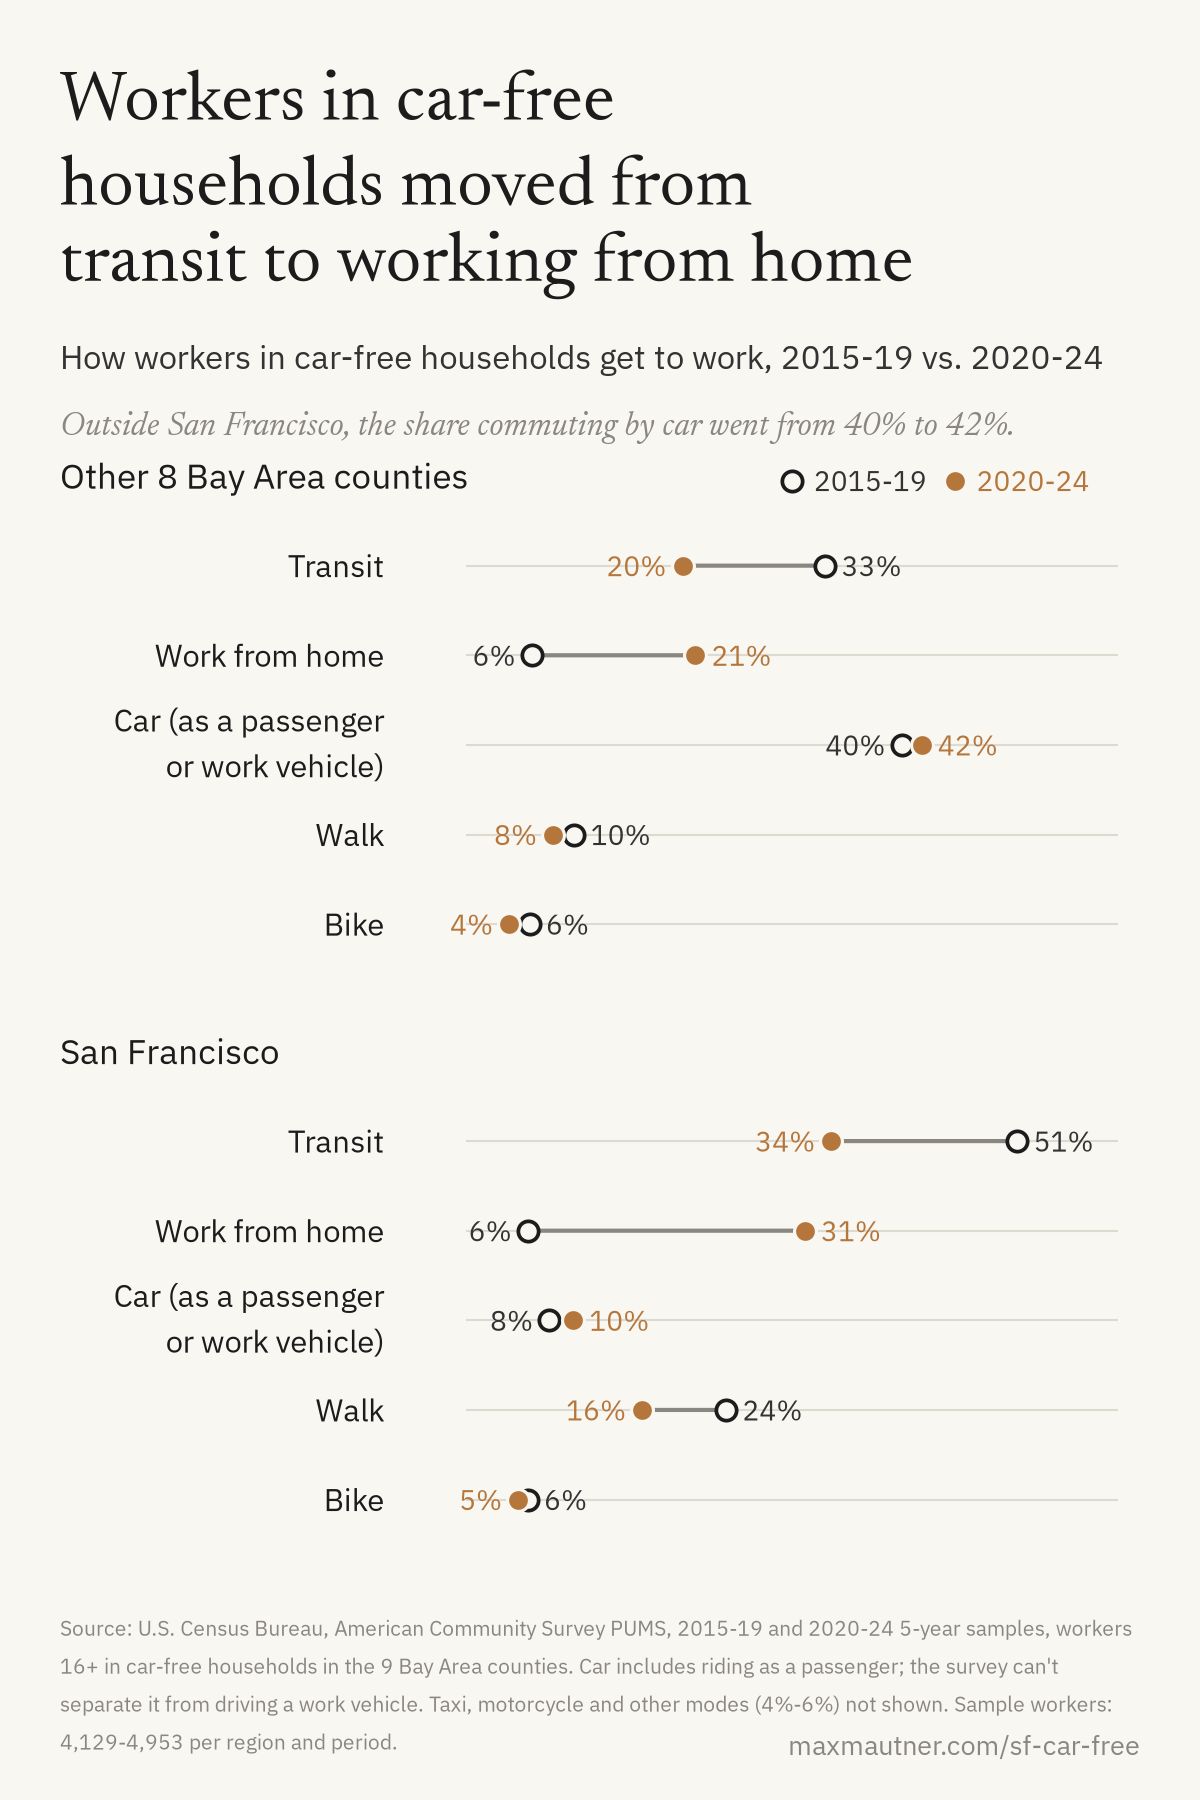
Transit commuting fell sharply between the 2 periods, and workers in car-free households replaced it with working from home. The share getting to work by car hardly changed. Outside San Francisco, households where everyone works from home go without a car no more often than households where everyone commutes. Fewer than 1 in 20 of these workers bike.
Outside San Francisco, higher-income households in large apartment buildings are more likely to be car-free (8%) than lower-income households in detached houses (6%). Households that plan to live without a car may choose apartments for that reason, so the pattern can’t show that the building causes it.
Families with young kids are the least likely to go without a car, ~3%, the same as in 2015-19. My household is one of them: I haven’t owned a car in ~5 years, and my wife and I get our infant around San Mateo by bus, stroller and cargo bike.
Can the car-free households that could afford a car grow fast enough to keep the region at 1 in 10 as fewer seniors and lower-income households go without one?
The charts are generated by this code, which lists every input and its source.
Enjoyed this post? Get new posts via email