Essay · TRANSPORTATION
How fast is a car, after you pay for it?

In 1974, Ivan Illich worked out the speed of the typical American driver. He counted the hours spent sitting in the car, parking it and searching for it, plus the hours worked to pay for the car, its gas, tolls, insurance, taxes and tickets:
The model American puts in 1600 hours to get 7500 miles: less than five miles per hour.
Illich was a Catholic priest and social critic. His short book Energy and Equity argued that past a certain speed, transportation stops serving people and harms society.
His arithmetic is 50 years old, so I redid it with current US numbers. I limited it to trips under 8 miles, the trips an e-bike can realistically replace. They average 3.3 miles and make up ~18% of the miles that Americans currently drive (2022 National Household Travel Survey).
The median American worker earns $23.80/hour, or ~$19 after taxes. A used car driven the US average of ~10,900 miles a year costs ~$8,200, counting $1,700 a year for a parking space at home. That is ~430 hours of work before the car moves. A new car takes ~700 hours. A $999 e-bike ridden 3,000 miles a year takes ~25 hours.
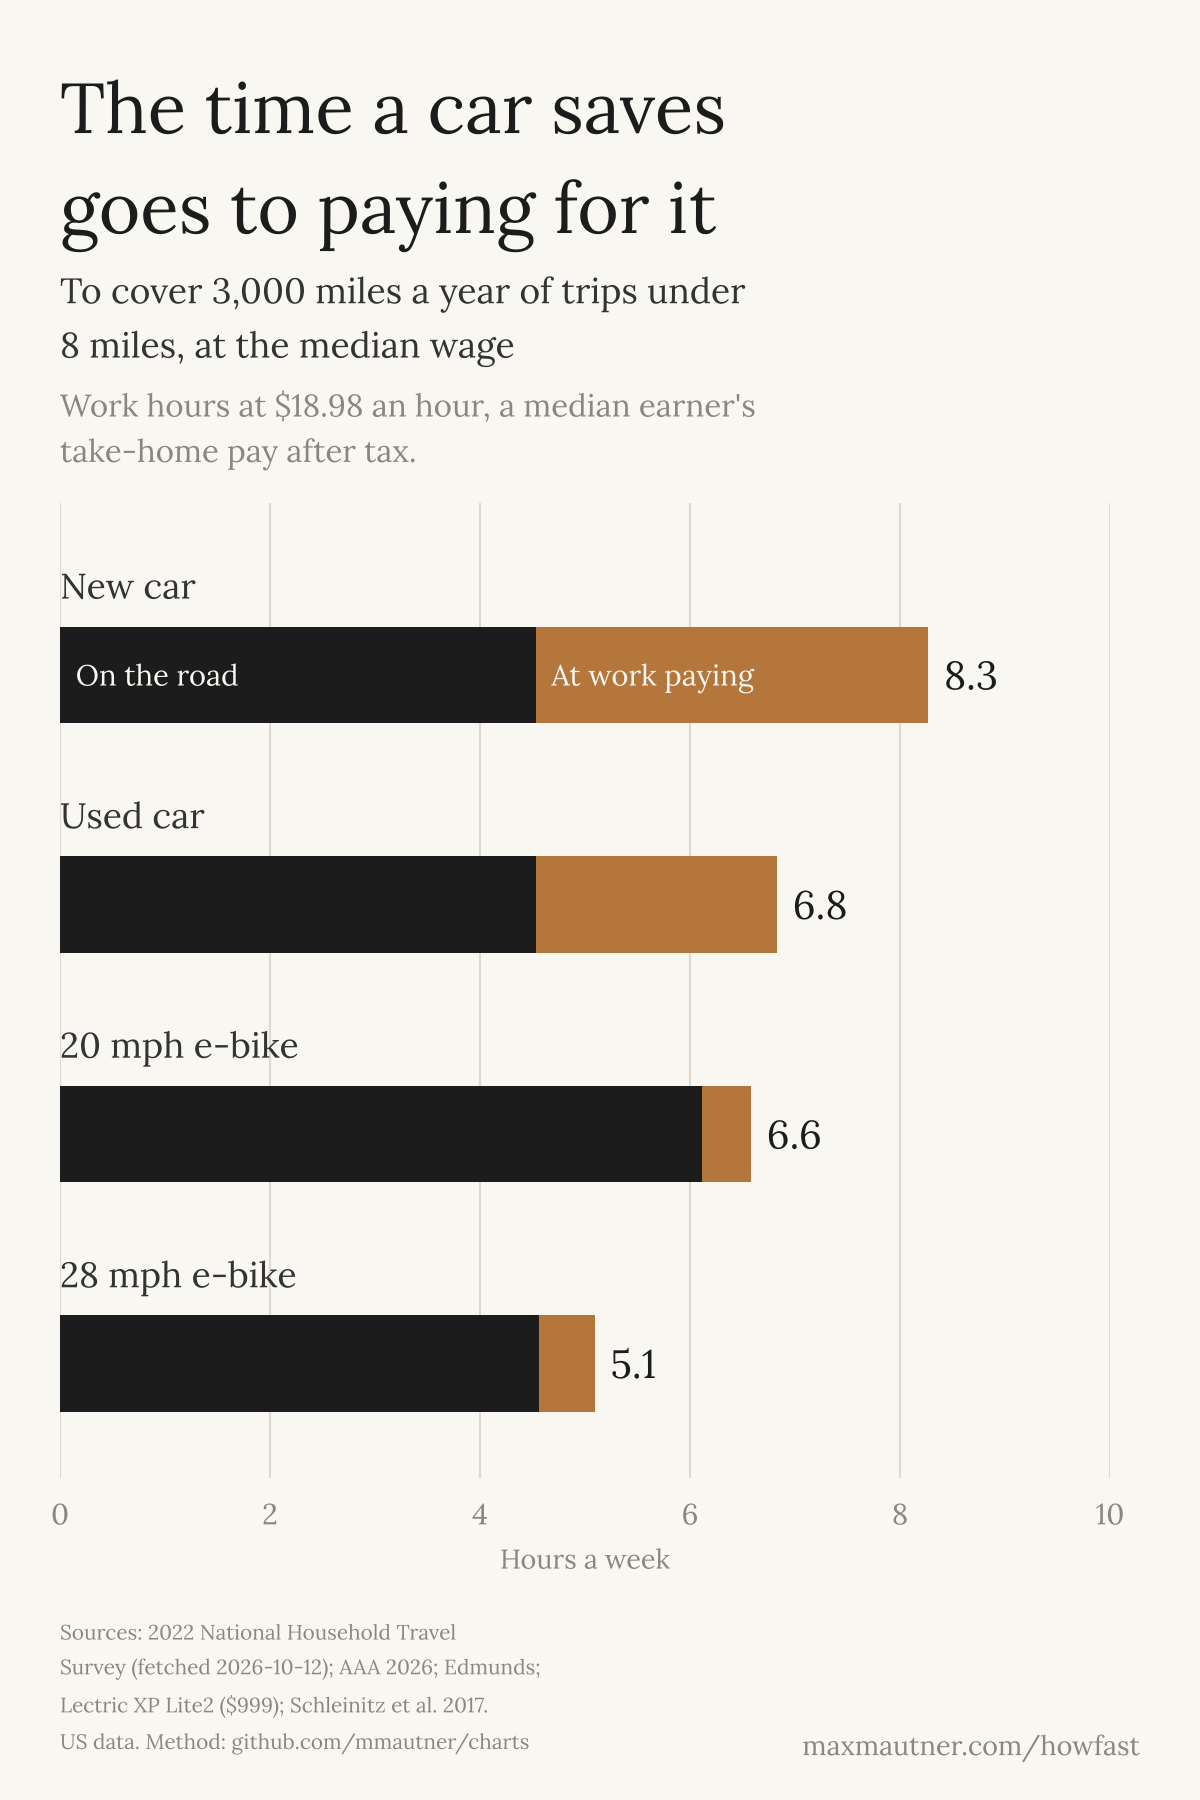
It’s true, the car is capable of faster speeds on the road when not trapped in congestion. On a short trip the car averages 12.7 mph door to door, including the time to park and walk to the door. An e-bike with 20 mph assist averages 9.4 mph once it stops at lights and gets locked up. Counting the hours worked to pay for each vehicle, the used car loses its lead and the new car falls behind both e-bikes.
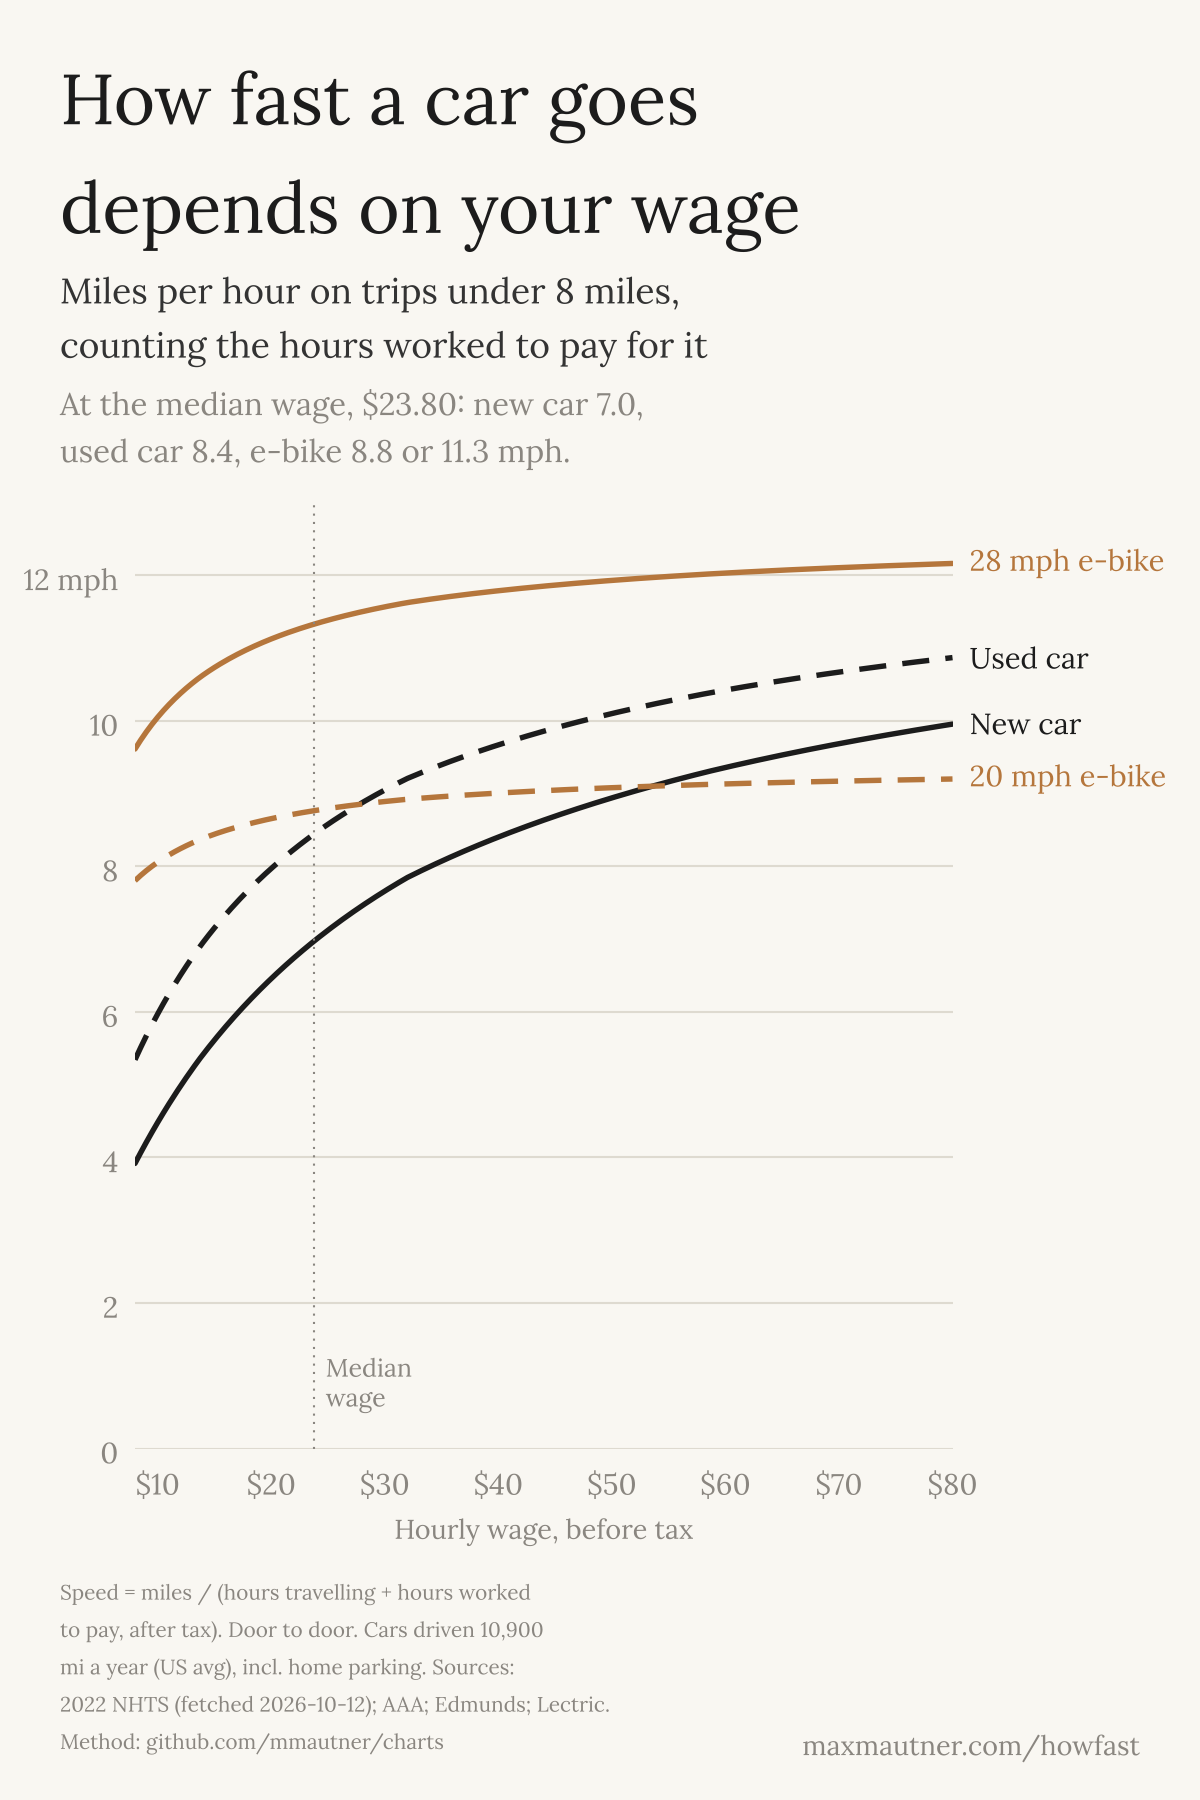
A car’s speed depends on its owner’s wage. Each extra dollar an hour means fewer hours worked for every mile, so the car lines rise higher. An e-bike costs so little to own that its line barely moves. A used car only overtakes the 20 mph e-bike for workers earning more than ~$28 an hour, and never catches an e-bike set to 28 mph assist, which California allows as a Class 3 e-bike. The people who earn the least pay the most hours for their speed, which is the inequity Illich was describing.
The static chart above assumes that a car is driven the US average of ~10,900 miles a year. A car driven less spreads its insurance, depreciation and parking over fewer miles, so each mile costs more. You can play around with different annual driving mileage to see how that influences the “speed” curves:
The car keeps its advantage on longer trips, the other ~82% of miles driven. Those trips are long because of where homes in America are legally allowed to be built. Housing near jobs costs the most, so wage workers who can’t afford it move farther out and “buy” back the distance with a car (also known as “driving till you qualify [for a mortgage].”
Illich’s name for this was “radical monopoly” (Wikipedia). Once a region is built around a fast vehicle, everyone has to own one, and the buildings and trip distances grow to accommodate the speed and space demands of cars. The average American commute reached a record 27.6 minutes each way in 2019, after decades of road building.
Trips get shorter when homes are built near the places people go. Every apartment a city allows near jobs, shops and transit moves more trips under 8 miles, where the cheapest vehicle is also the fastest. Parking minimums and single-family zoning push them back out.
The numbers are US averages and one example of each vehicle: AAA’s average new car, a 2022 Volkswagen Passat priced by Edmunds as the used car, and a Lectric XP Lite2 as the e-bike.
The charts are generated by this code, which lists every input and its source.
Enjoyed this post? Get new posts via email