Essay · TRANSPORTATION
Driving 5 mph slower beats driving 5% less

Since our baby came home from the hospital, I have been evaluating the car-safety choices within my control. Two of them cost nothing: drive slower or drive less.
A household that drives 5% fewer miles has ~5% fewer chances to crash, assuming the miles cut are as dangerous as the miles kept.
Rune Elvik’s 2009 meta-analysis of 115 studies found that fatal crashes fall much faster than speed does. For example, going from 65 to 60 mph on a freeway (an 8% cut in speed) cuts fatal crashes ~28%. Going from 35 to 30 mph (a 14% cut) cuts them ~33%. To frame that in time costs, it costs ~90 seconds to drive 60 vs. 65mph on a 20-mile freeway trip.
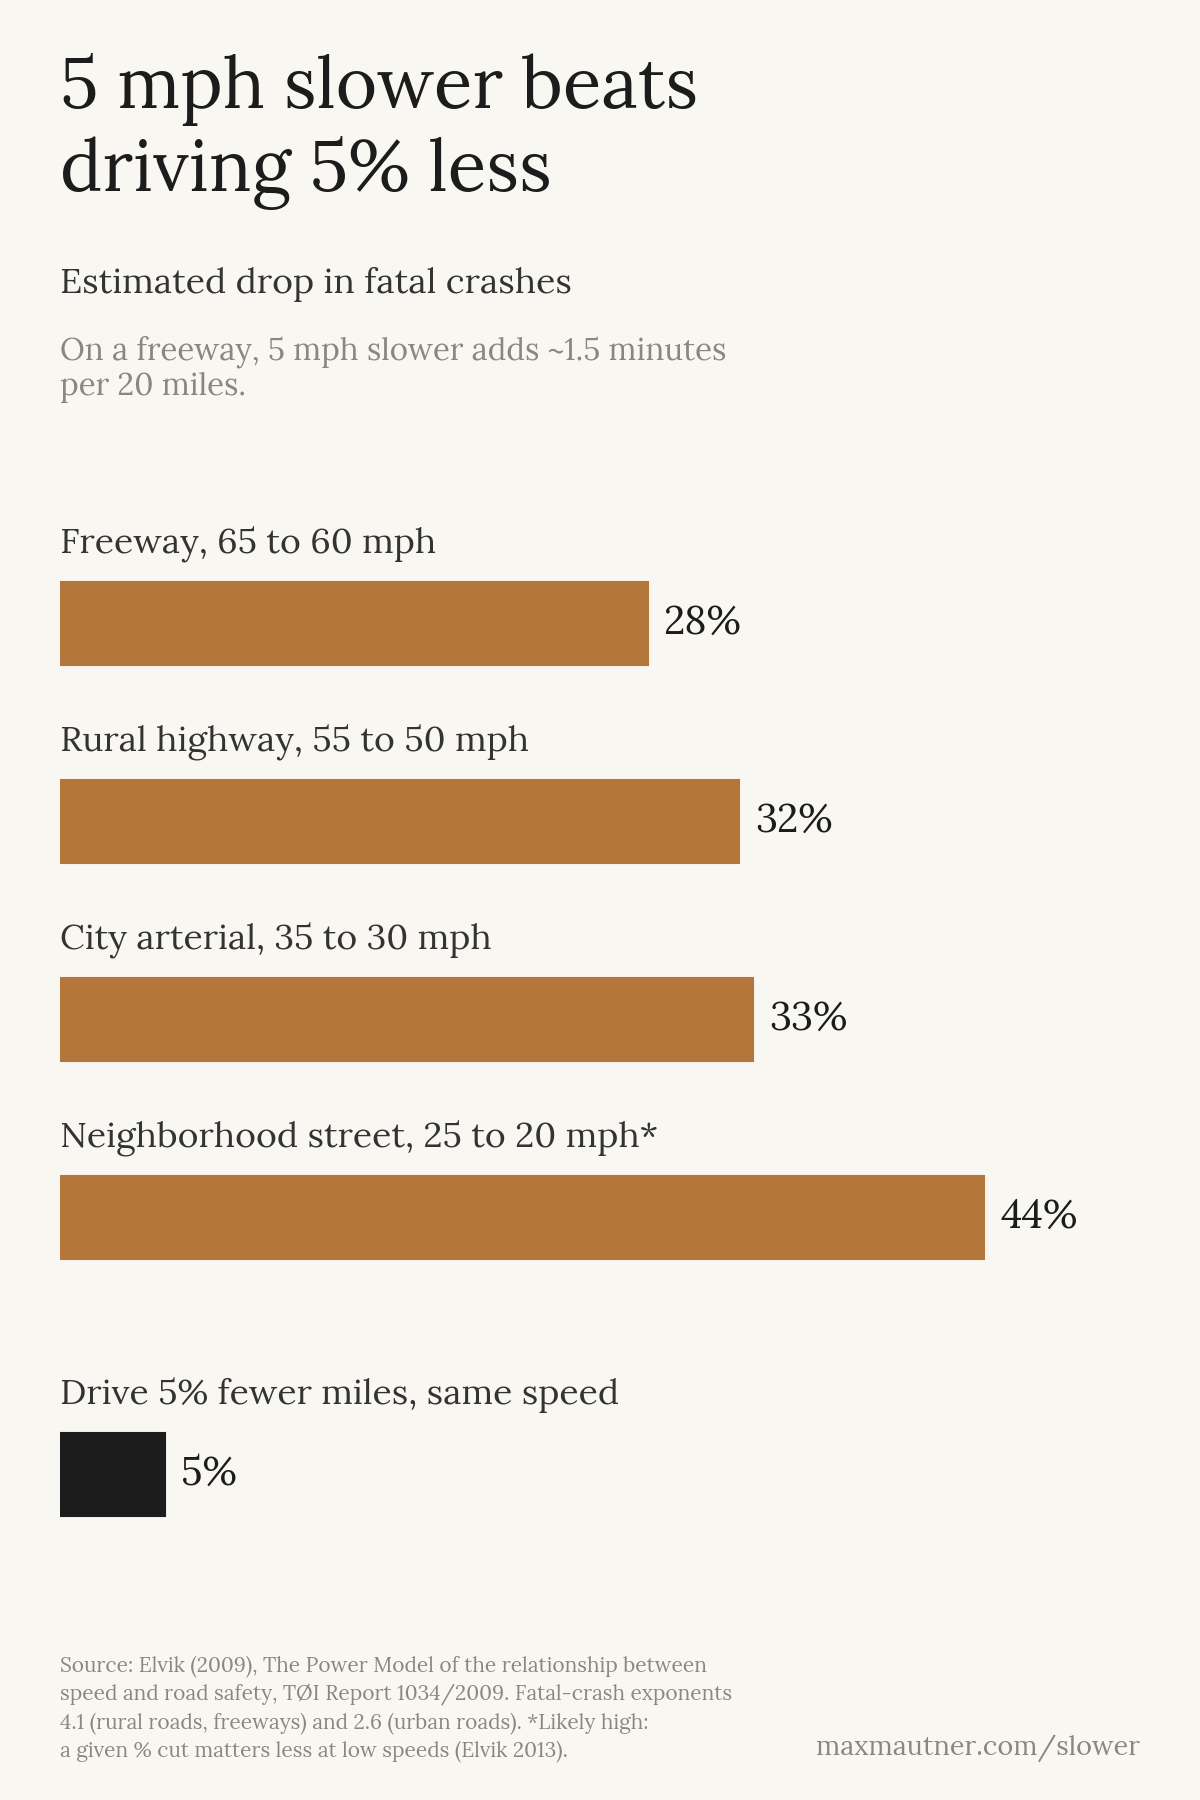
Those figures come from changes in a road’s average speed, but one driver going slower than the traffic around them is a different situation. A 2019 meta-analysis found the relationship between speed and safety is the same for individual drivers as for a road’s average. Elvik’s own follow-up work found that a given percentage cut matters less at low starting speeds, so the 44% figure for a 25 mph street is likely high.
Slowing down reduces the crashes we cause and how bad they are. It does nothing about a driver who runs a red light into you, and fewer miles means less exposure to that driver too.
A 2005 study of California households compared families that were alike except for how densely built their neighborhoods were. For every 1,000 fewer homes per square mile around them, a household drove almost 1,200 more miles a year. The average American household drove ~20,600 miles in the 2017 National Household Travel Survey, so that density difference alone is worth ~6% of a year’s driving.
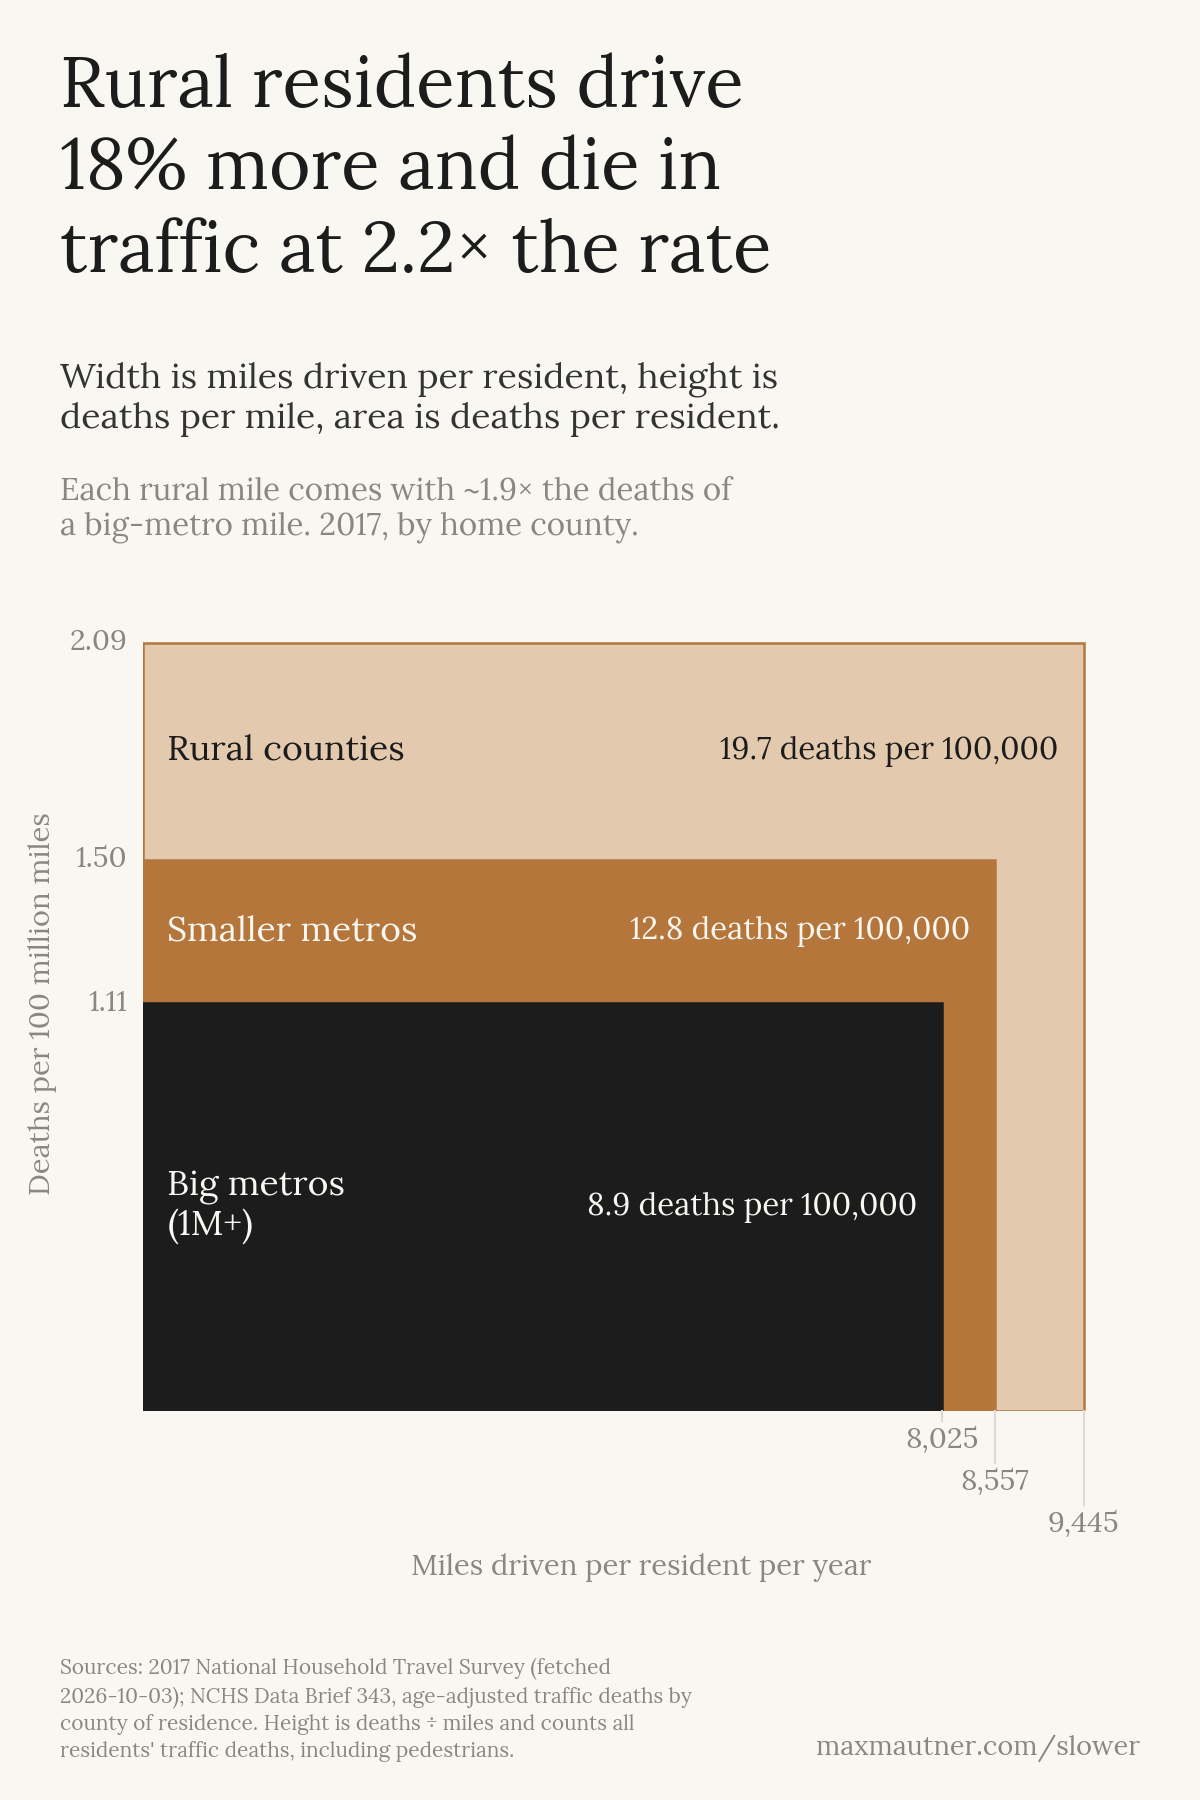
Counted by the county a person lived in, rural residents died in traffic in 2017 at 2.2x the rate of residents of metro areas over 1 million, according to death-certificate data from the CDC. The same year’s travel survey shows rural residents drove only 18% more miles per person. Each mile driven by a rural resident came with ~1.9x the deaths of a mile driven by a big-metro resident.
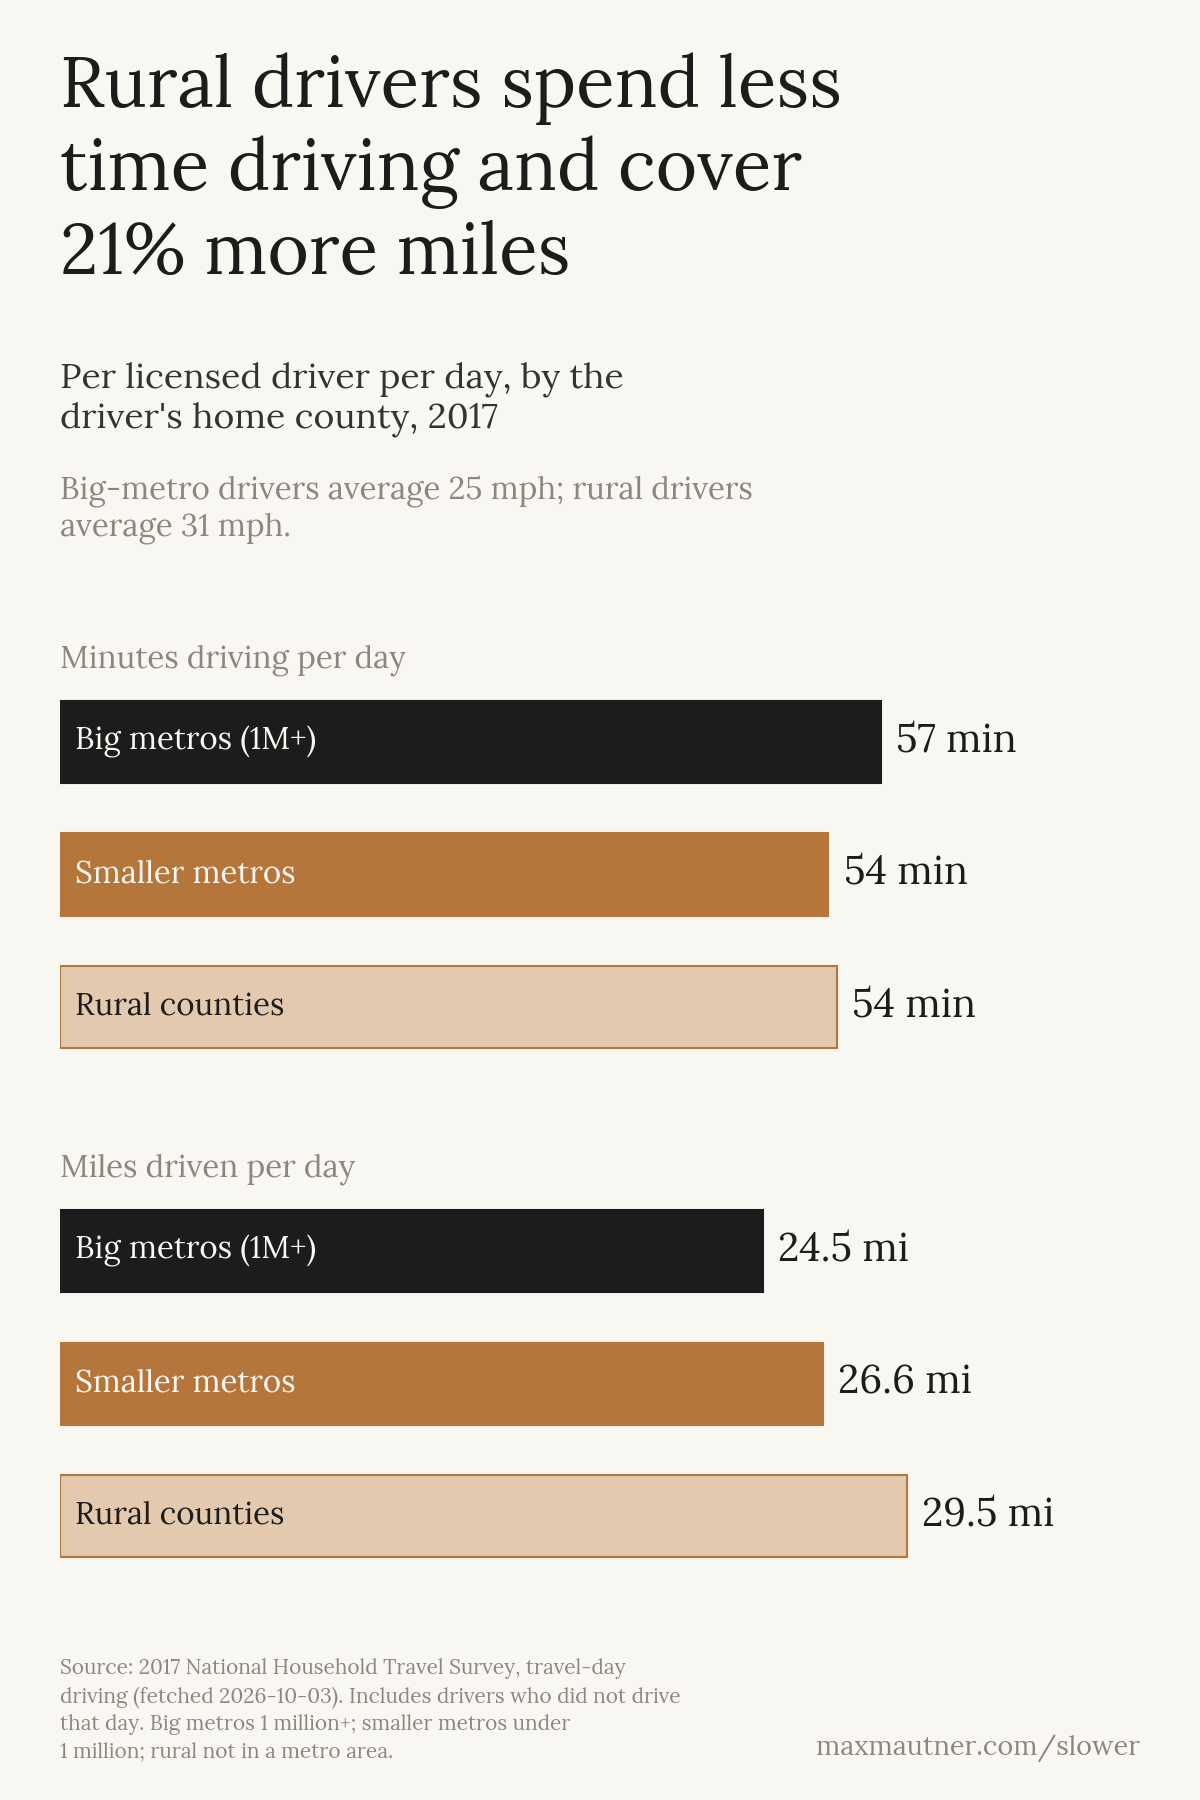
Rural drivers in the 2017 survey spent less time driving each day than big-metro drivers (54 vs. 57 minutes) and covered 21% more ground (29.5 vs. 24.5 miles). They averaged 31 mph to the big-metro drivers’ 25, on the rural roads where Elvik found a given cut in speed prevents the most deaths.
The real estate phrase “drive till you qualify” describes buyers who keep looking farther from work until they find a house cheap enough to qualify for a mortgage. I could not find a study that measures whether home prices reflect the traffic risk that comes with a location. A study by Bishop and coauthors comes closest to measuring it in finding that home prices are higher where older Americans’ risk of dying from any cause is lower.
Another study found that traffic death rates were highest in exurban counties and concluded that home buyers largely fail to account for that danger, though it did not survey buyers to show it. The study’s author also pointed out that parents choose homes for their schools without considering that their young children will have to walk those roads and grow into teenagers driving those roads.
The charts are generated by this code, which lists every input and its source.
Enjoyed this post? Get new posts via email