Essay · TRANSPORTATION
2 tools for asking San Mateo for safer streets

I recently built 2 tools for understanding San Mateo street safety. The crash lookup counts the people hurt in police-reported crashes near any intersection, using the state’s crash records. The speed lookup shows how fast drivers go on the 123 street segments in the city’s 2026 speed survey, which I got through a public records request.
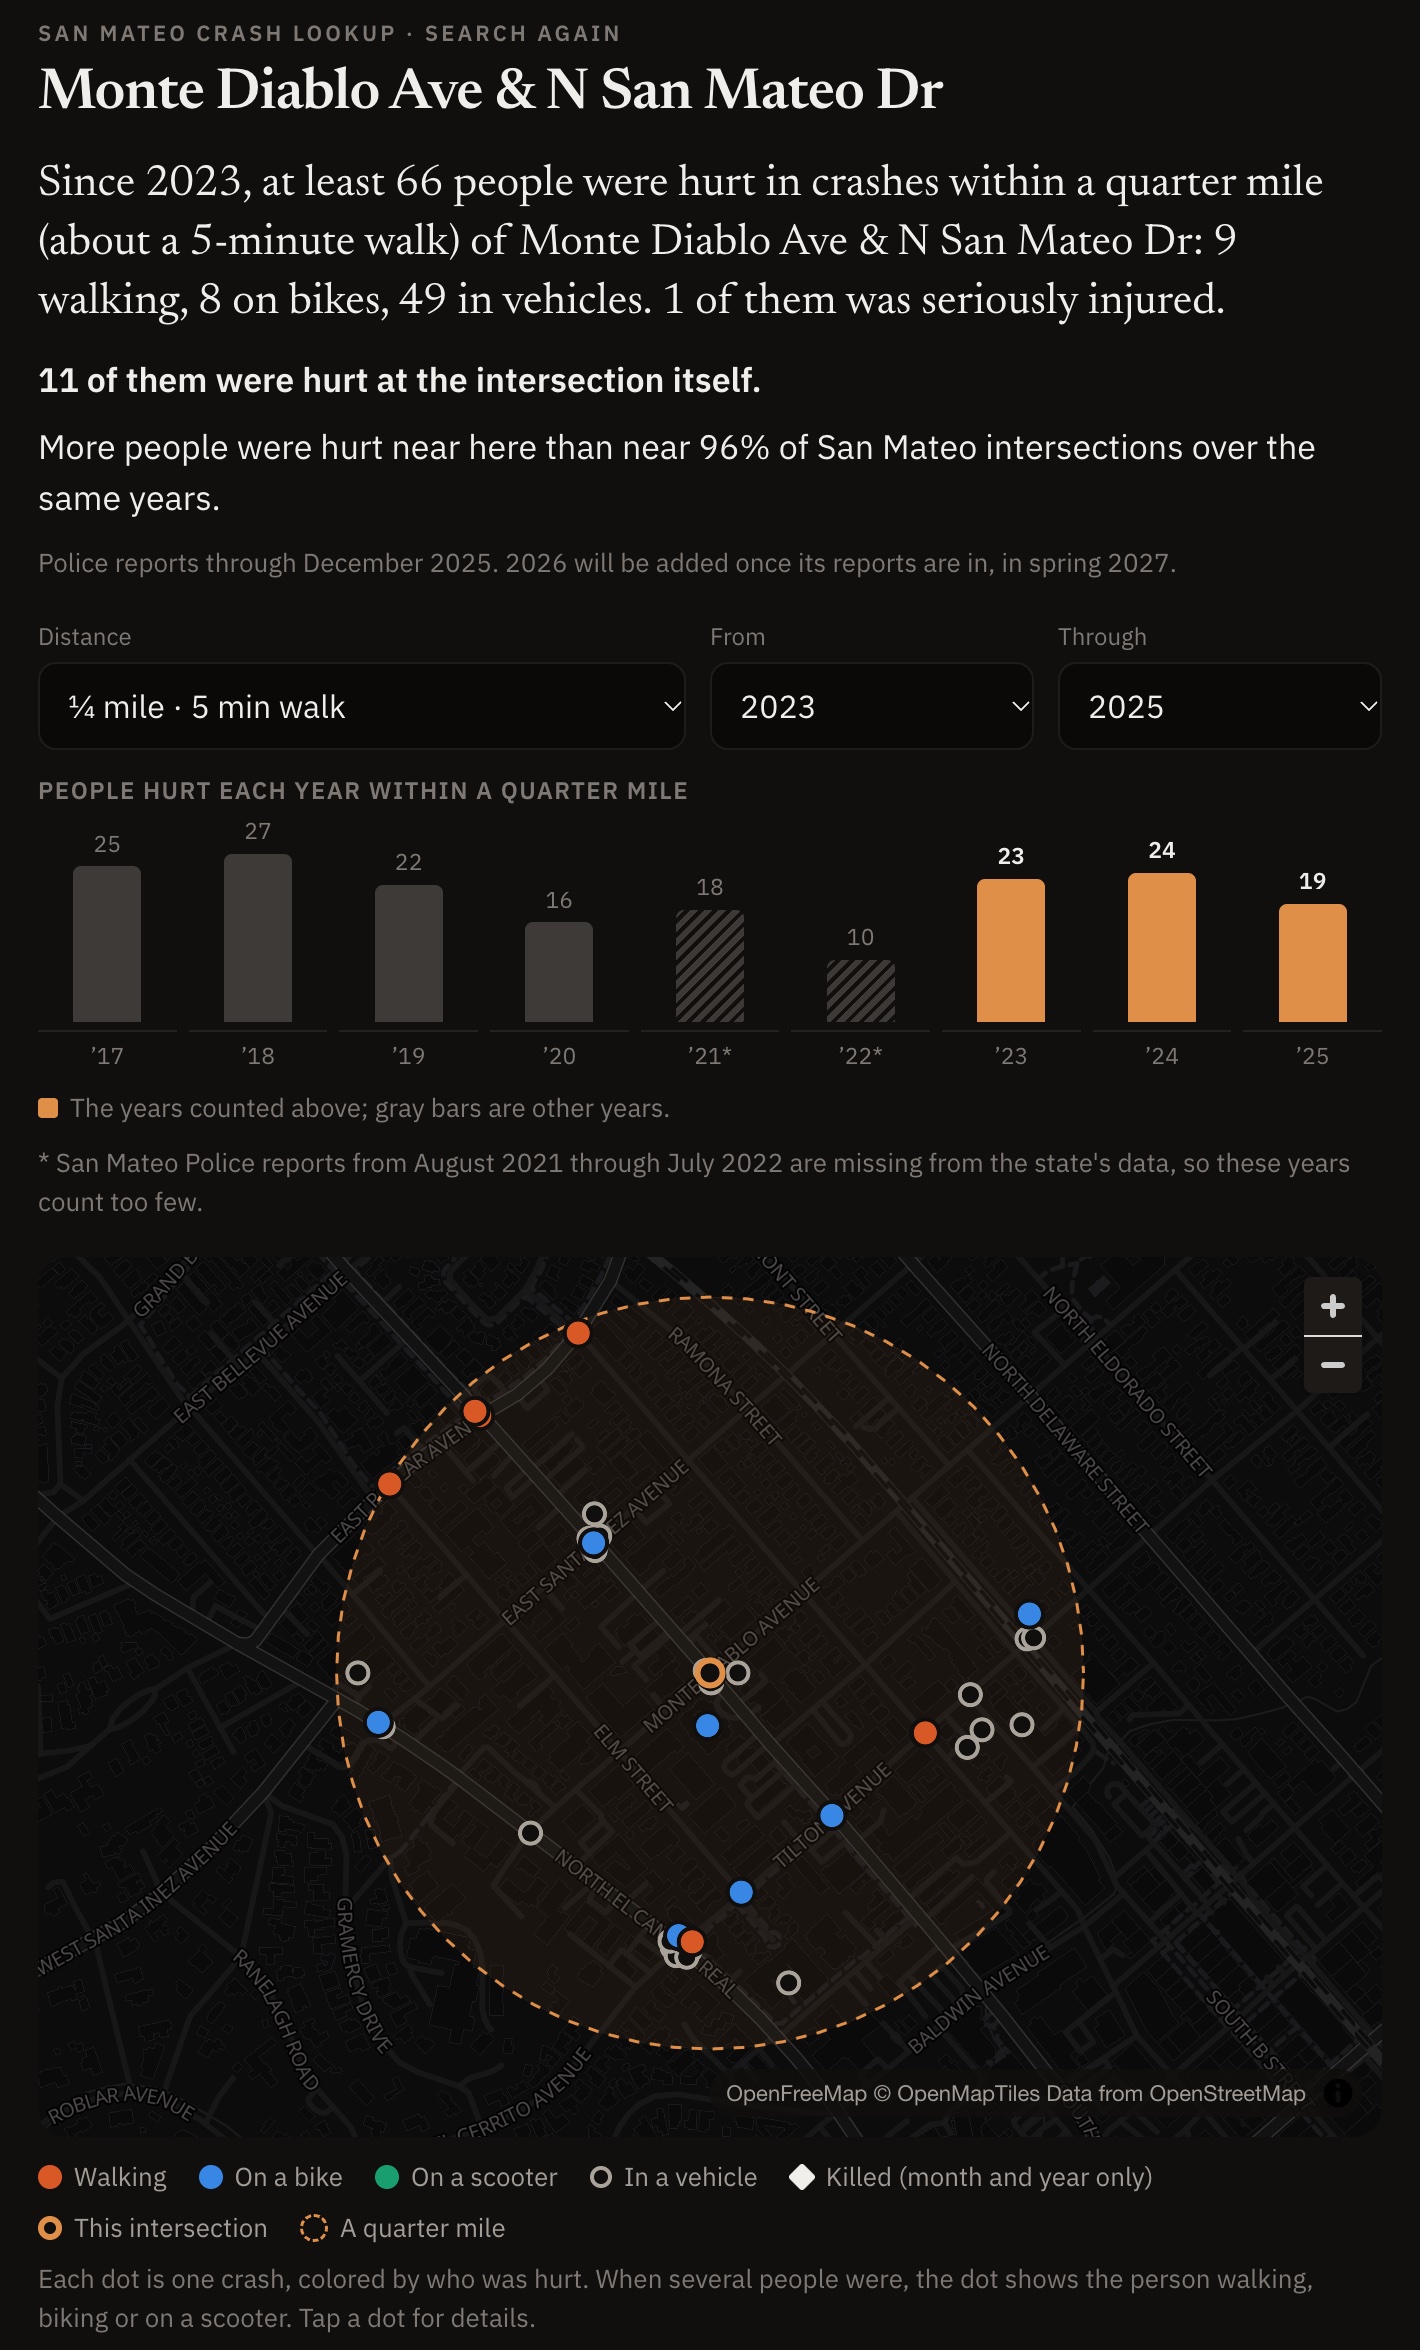
Every one of those 66 people was hurt before Sept. 11, 2026, when an all-way stop went in at Monte Diablo Ave & N San Mateo Dr. Each intersection page has a button that drafts an email addressed to the district’s council member and to Public Works with the corner’s crash numbers filled in–and mentions of the city’s own plans to address safety at the intersection or corridor.
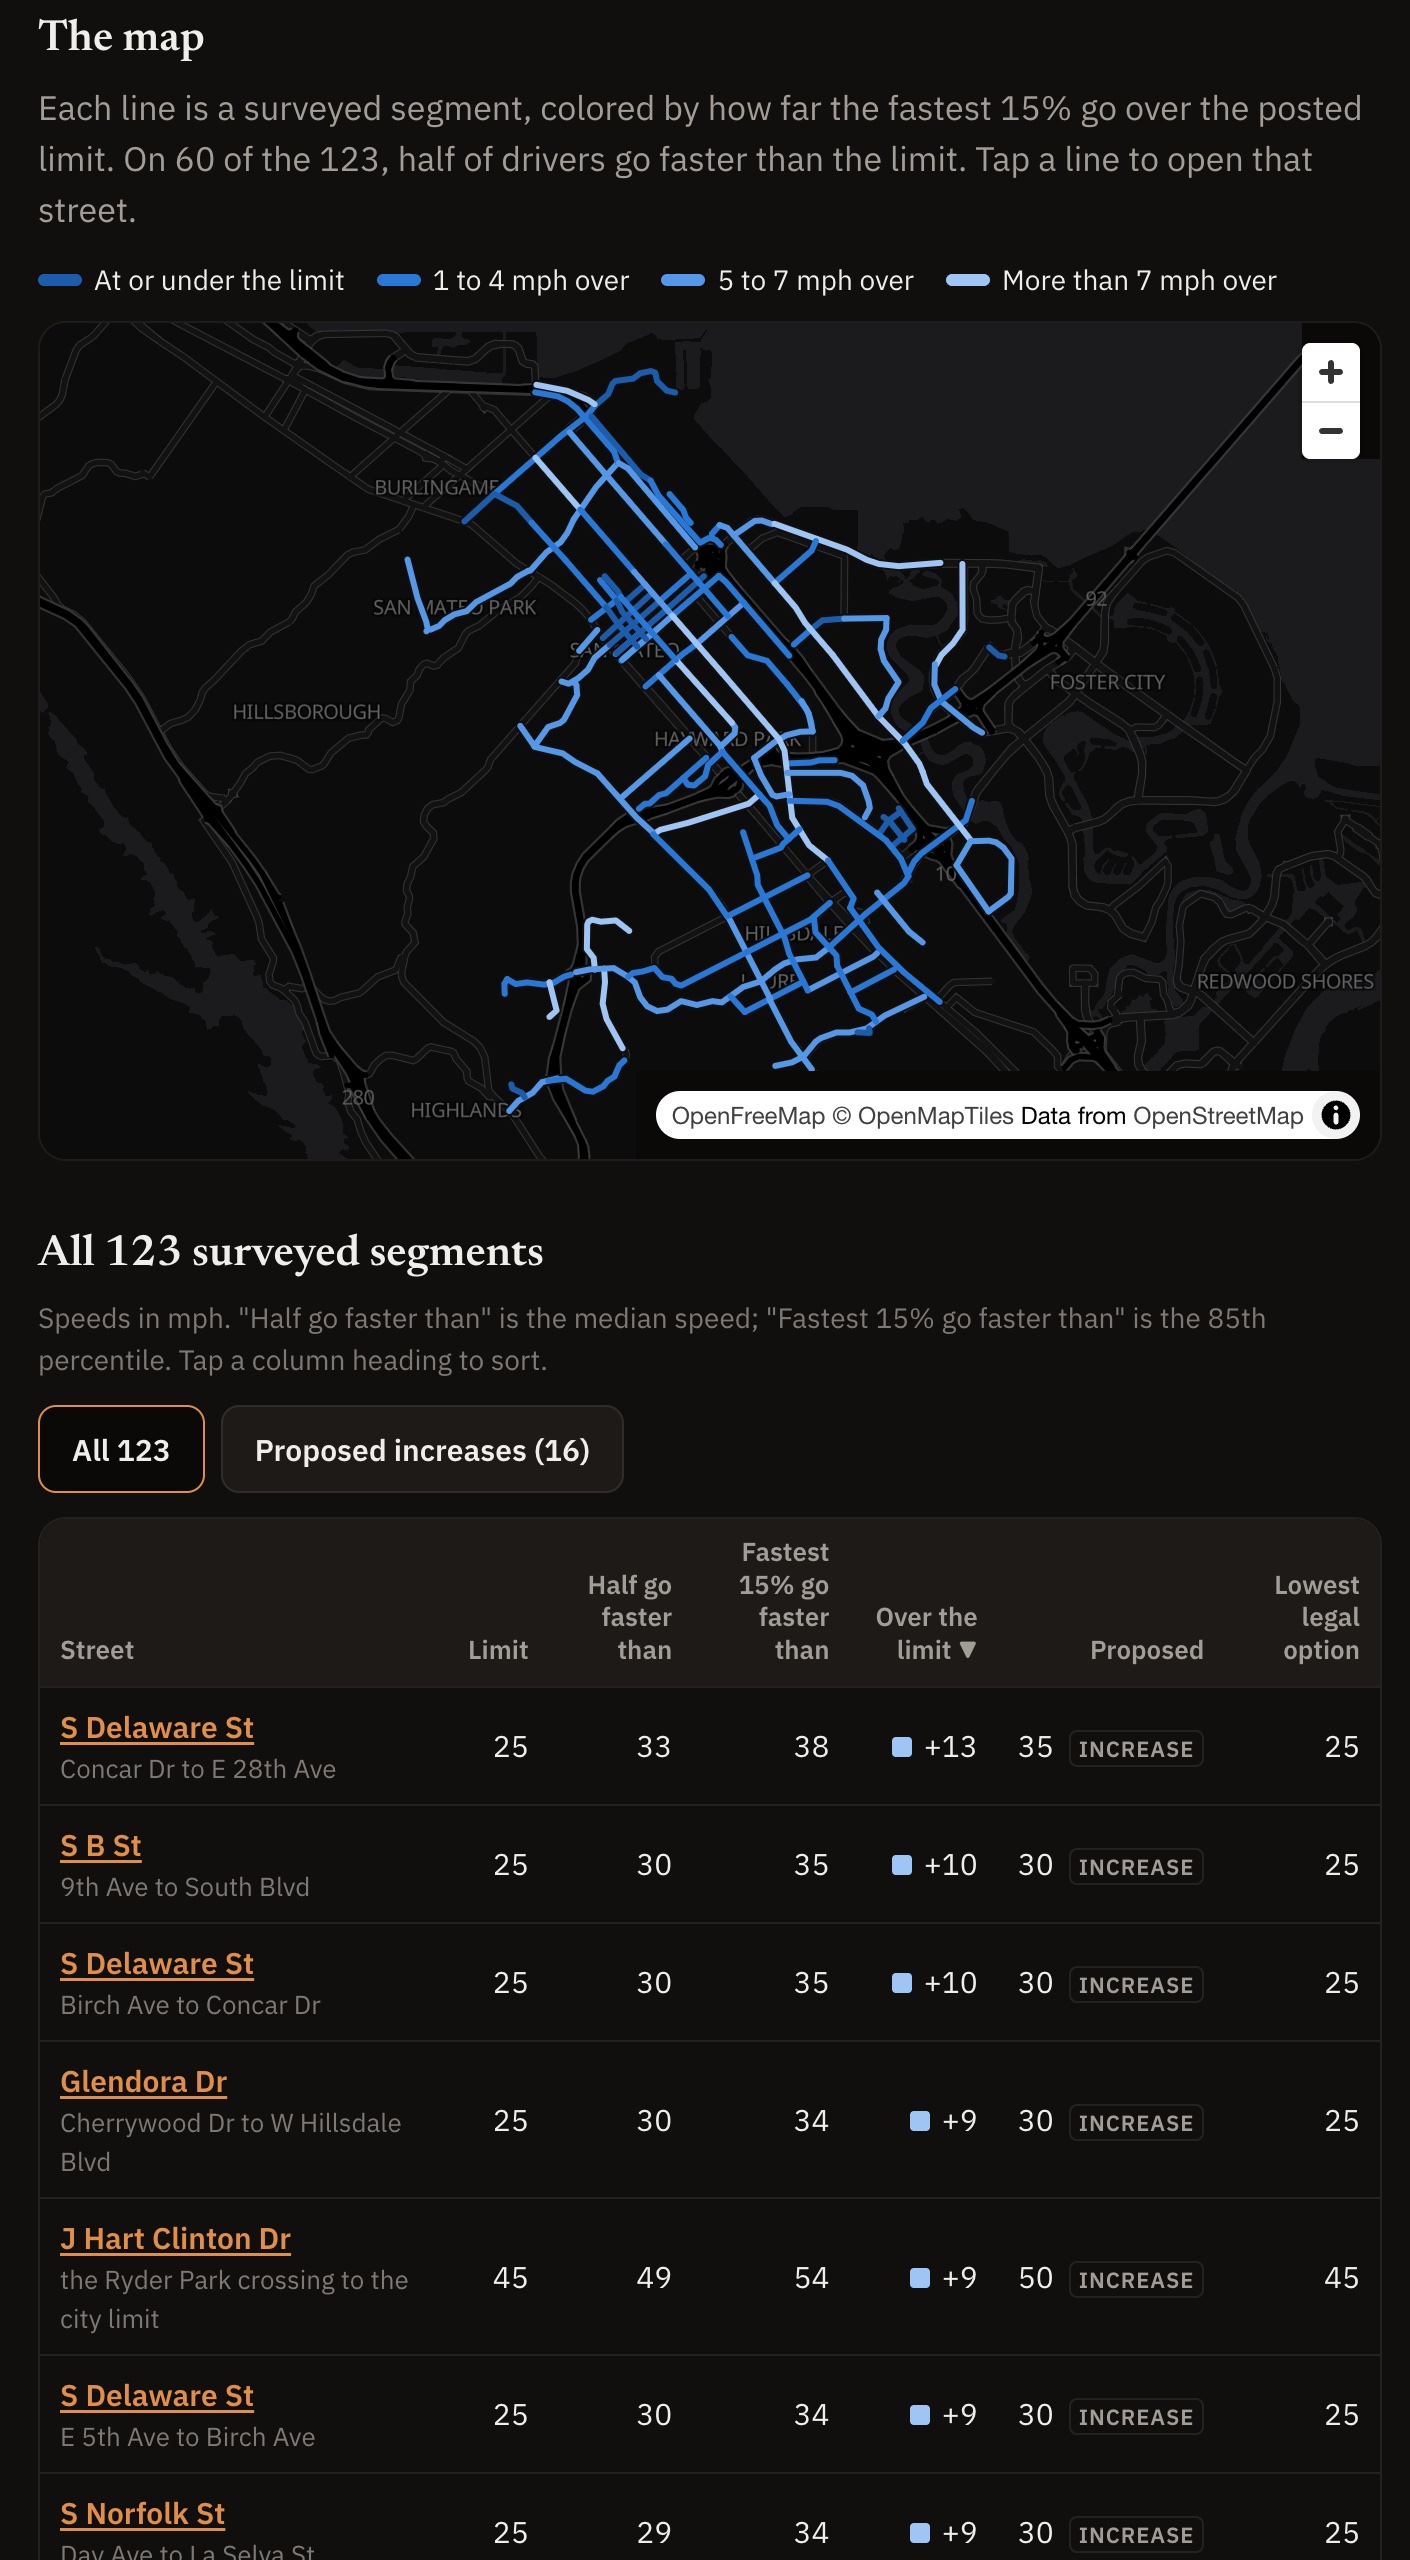
On Sept. 22 the City Council discussed speed survey results and chose to set aside 15 of the increases in the wake of a student hit in a crosswalk the week prior. Council directed staff to bring the speed limit hikes back for review at a future study session. None of the staff’s recommended speed limit increases are required by state law, and each segment’s page in the tool lists the legal justification that the city (council, staff, city attorney) can keep the current limit–which is worth raising when the study session is scheduled in the coming months, as raising speed limits has a ratcheting effect that is difficult to reverse.
Enjoyed this post? Get new posts via email